Digital Marketing
How to Capture Google Ads Data in Webflow
Track the source of every form submission, from campaign to keyword, so you can understand which ads are driving leads and customers.
Start a free trial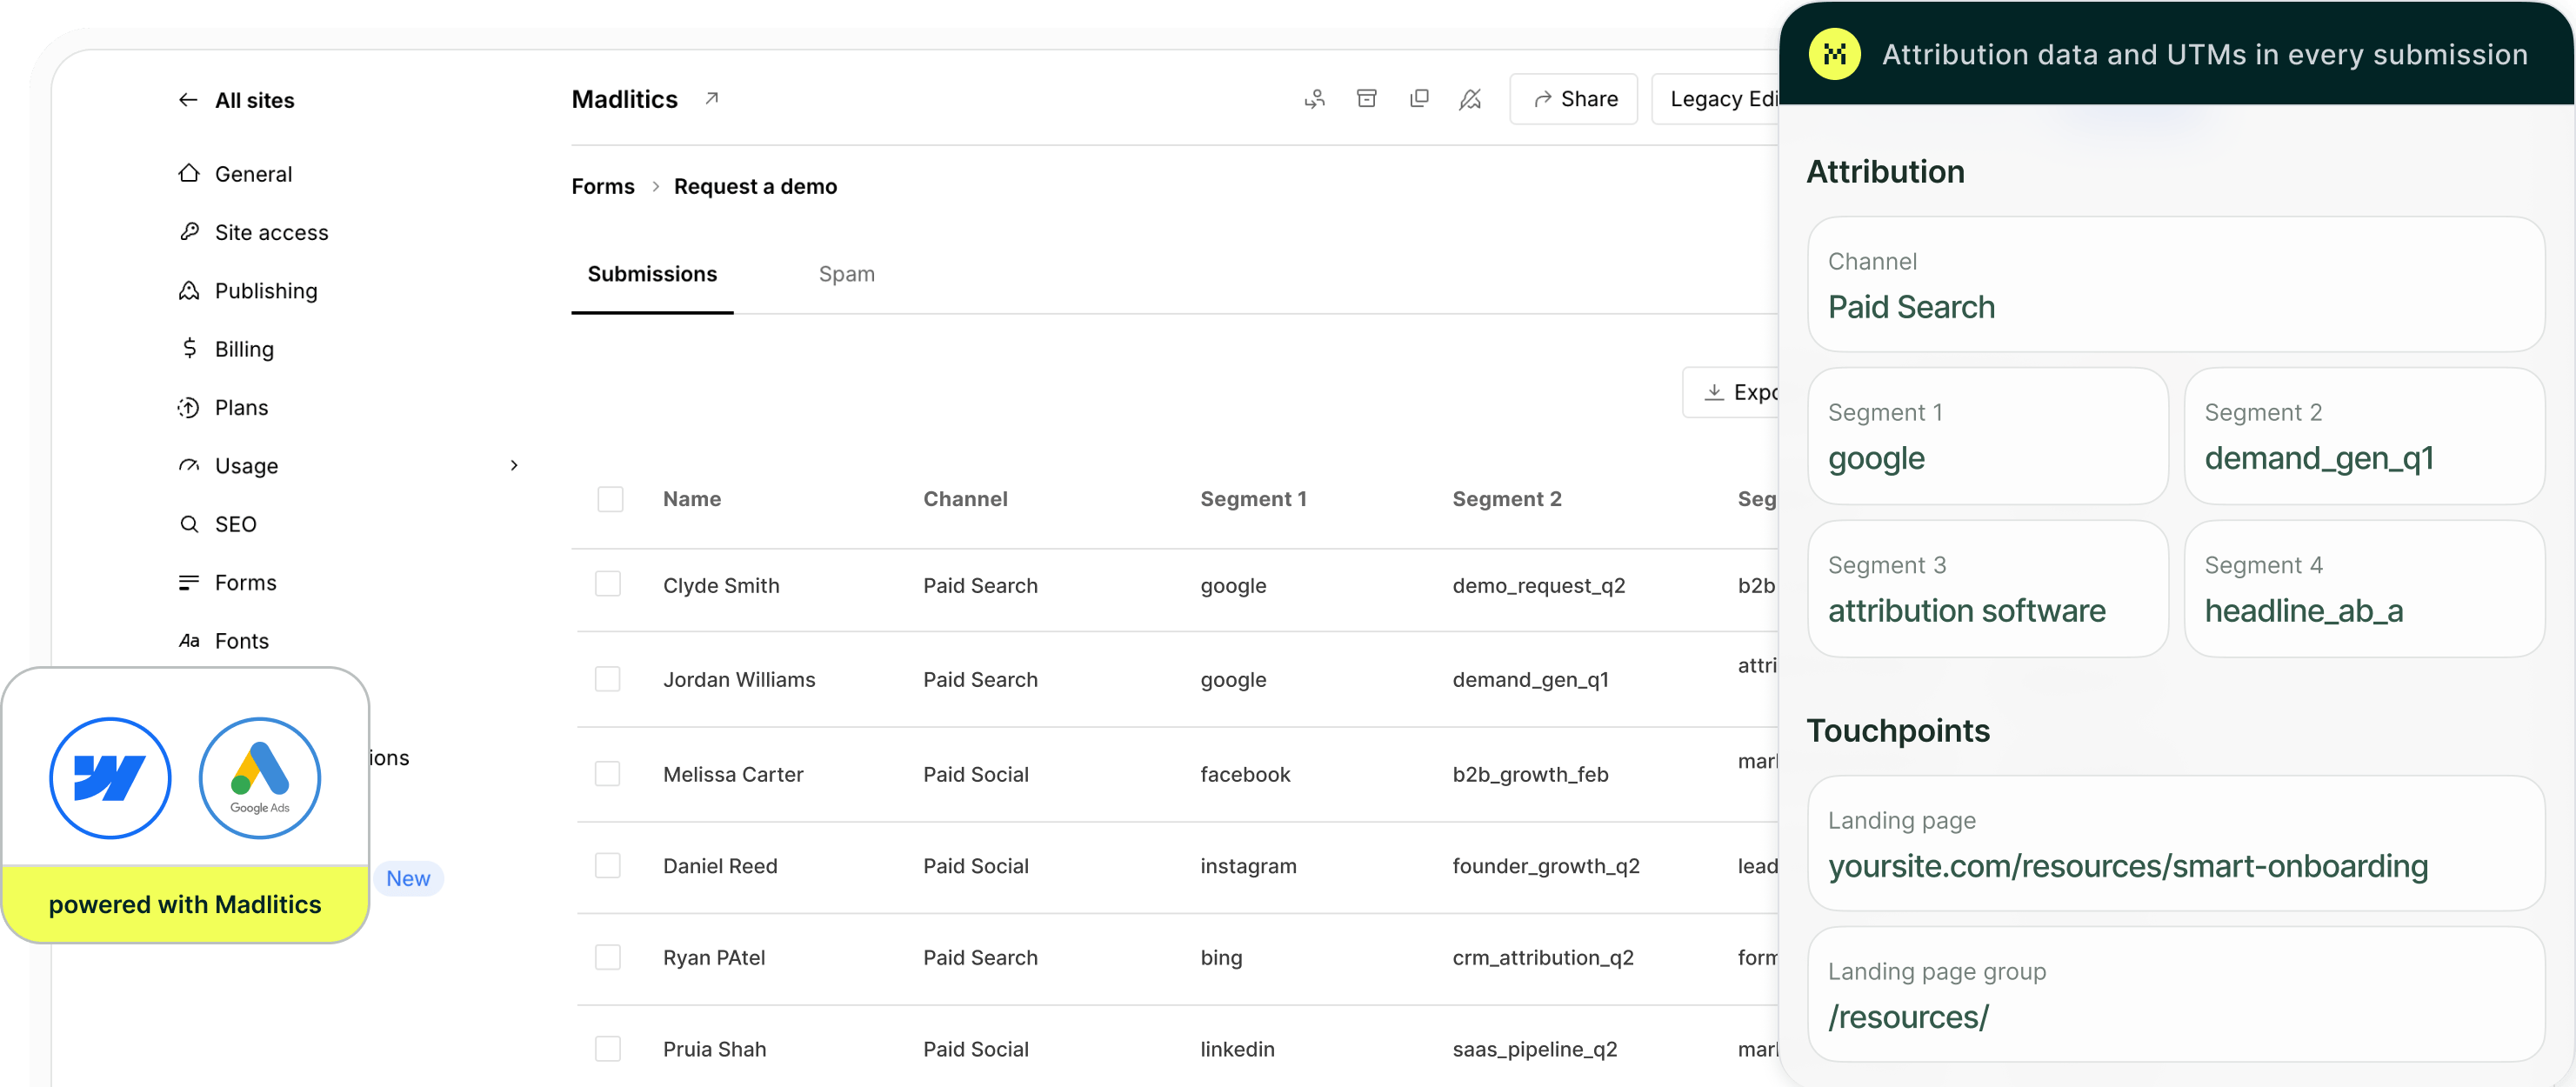
Google Ads is a cornerstone of modern digital marketing, helping businesses reach high-intent audiences actively searching for solutions. From Search and Display to YouTube and Shopping, it’s a reliable way to drive traffic, generate leads, and capture demand at scale. For many teams, it’s one of the most consistent and controllable growth channels. While driving traffic is part of the equation, what really matters is knowing which campaigns are generating actual business results.
This article shows how to use Madlitics to capture Google Ads data in Webflow and pass that attribution into your CRM, marketing tools, or BI platform. With Google Ads and Webflow working together, you can track which campaigns and keywords are generating form fills, qualified leads, and revenue, so you can double down on the ad spend that’s actually moving the needle.
See which campaigns drive real business results.
Revenue-focused reporting
Create reports showing which campaigns generate leads, customers, and revenue beyond traffic metrics.
Send data to your tools
Pass campaign and landing page data into ActiveCampaign, HubSpot, Zoho and existing workflows automatically.
Landing page conversion
Identify which landing pages, offers, and content generate the highest-quality leads and customers.
Persistent session data
Keep attribution attached to the lead even when visitors browse multiple pages or convert later.
It’s important to understand Google Ads performance because traffic alone does not show which campaigns are actually generating business growth. Visitor counts, clicks, and sessions help measure activity, but they do not explain which campaigns are producing qualified leads, creating customers, or generating revenue.
For example, one campaign may generate a large amount of traffic while contributing very little pipeline or revenue, while another campaign with lower traffic volume may consistently generate higher-value customers and stronger business outcomes. Here’s how the same campaigns look when you compare traffic metrics versus business outcomes.
Google Ads Campaign Performance Based on Traffic Metrics
Looking only at traffic metrics, the Display campaign appears to be the strongest performer because it generates the highest visitor volume at the lowest cost per visit. The Attribution Tool campaign appears less efficient because traffic volume is significantly lower and cost per visitor is higher.
Google Ads Campaign Performance Connected to Leads, Customers, and Revenue
Tracking Google Ads campaign effectiveness at the customer and revenue level reveals insights that traffic metrics alone cannot provide. While the Attribution Tool campaign generated significantly less traffic than the CRM campaign, it produced nearly 2x as many customers and more than 3x the revenue. The campaign also generated substantially higher revenue relative to ad spend, showing that lower traffic volume does not necessarily mean lower business impact.
The data also highlights how lead volume alone can be misleading.
By connecting Google Ads data to actual leads, customers, and revenue, it becomes much easier to understand which campaigns are truly driving growth. Madlitics sends attribution data directly into your forms, CRM, and reporting workflows so marketing decisions can be based on real business outcomes instead of traffic metrics alone.
Understanding Google Ads performance all the way through to customers and revenue starts with preserving attribution data from the first click through the final conversion. Madlitics works alongside Webflow to capture Google Ads attribution data, write it into form submissions automatically, and pass it into your existing marketing and sales workflows.
Any marketing effort that drives traffic, whether it is a paid ad, an email campaign, or an organic post, should use UTM parameters, making it easier to see where a visitor came from and which campaign brought the visitor to the site.
For Google Ads campaigns that send visitors to a Webflow landing page, UTMs typically include utm_source to identify Google Ads traffic, utm_medium to describe the channel, and utm_campaign to match your campaign name. Madlitics has a URL campaign builder to make adding UTMs as simple as possible.
Ex of a Google Ads URL with UTMs: yoursite.com/webflow-form?utm_source=google &utm_medium=cpc &utm_campaign=demand_gen_q1 &utm_term=crm+software

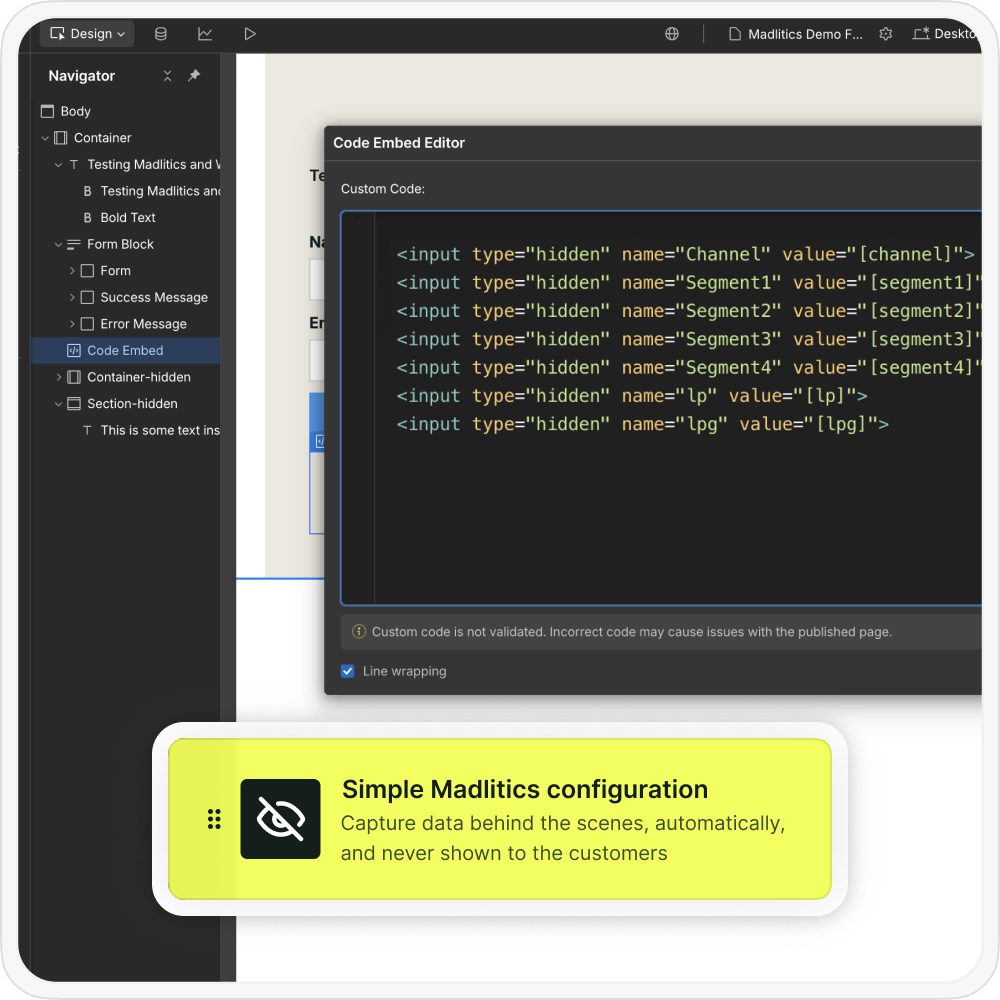
Once UTM tracking is added to inbound links, the next step is configuring your Webflow forms to collect attribution data automatically. Madlitics writes attribution data into dedicated form fields, while staying hidden from customers, and include:
When a visitor submits a Webflow form, Madlitics automatically writes the attribution data into the configured fields before submission. Instead of only seeing a name, email, or company, marketing and sales teams can also see:
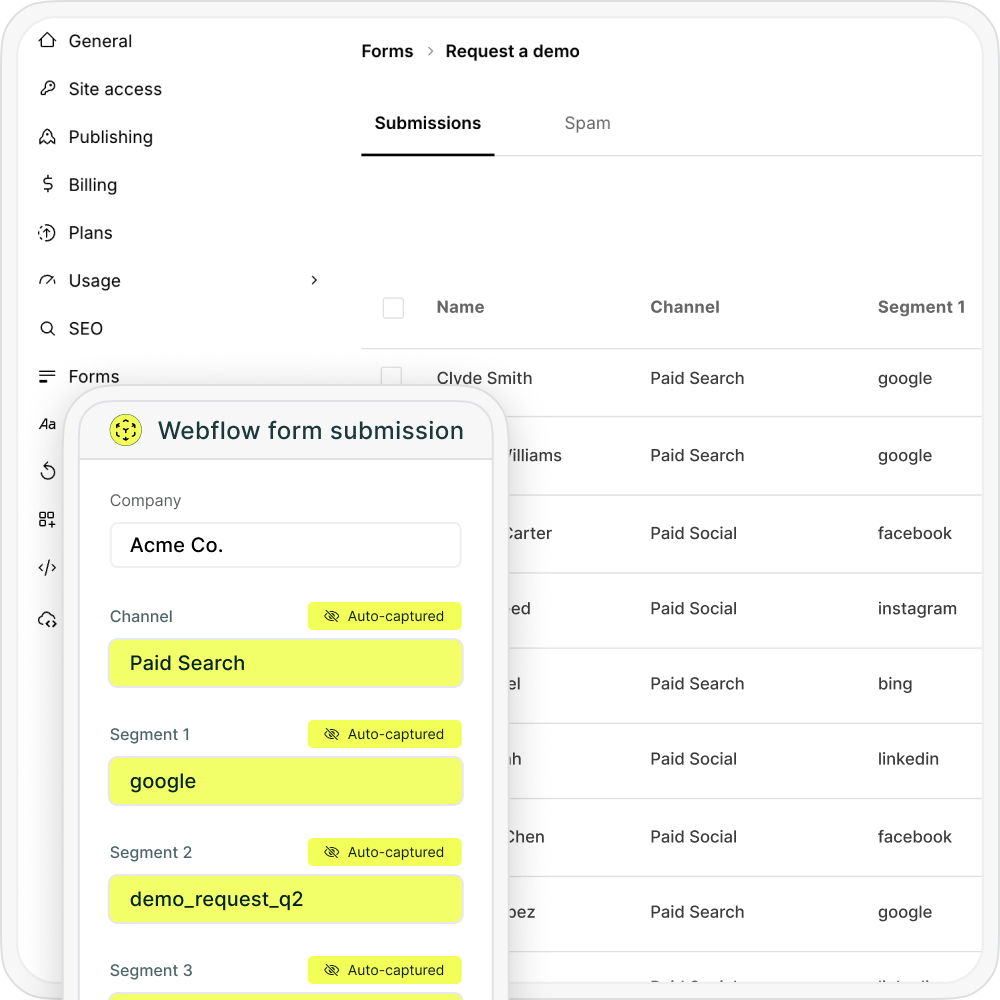

Once the form submits, Webflowreceives the customer’s details alongside full Google Ads attribution data. With attribution data connected directly to form submissions, marketing teams can clearly see which Google Ads campaigns are generating leads, customers, and revenue for the business.
Once Google Ads attribution data is connected to your leads and customers, reporting becomes significantly more actionable. Instead of only measuring clicks, sessions, or form submissions, marketing teams can analyze which campaigns, landing pages, and channels are actually generating qualified leads, customers, and revenue.
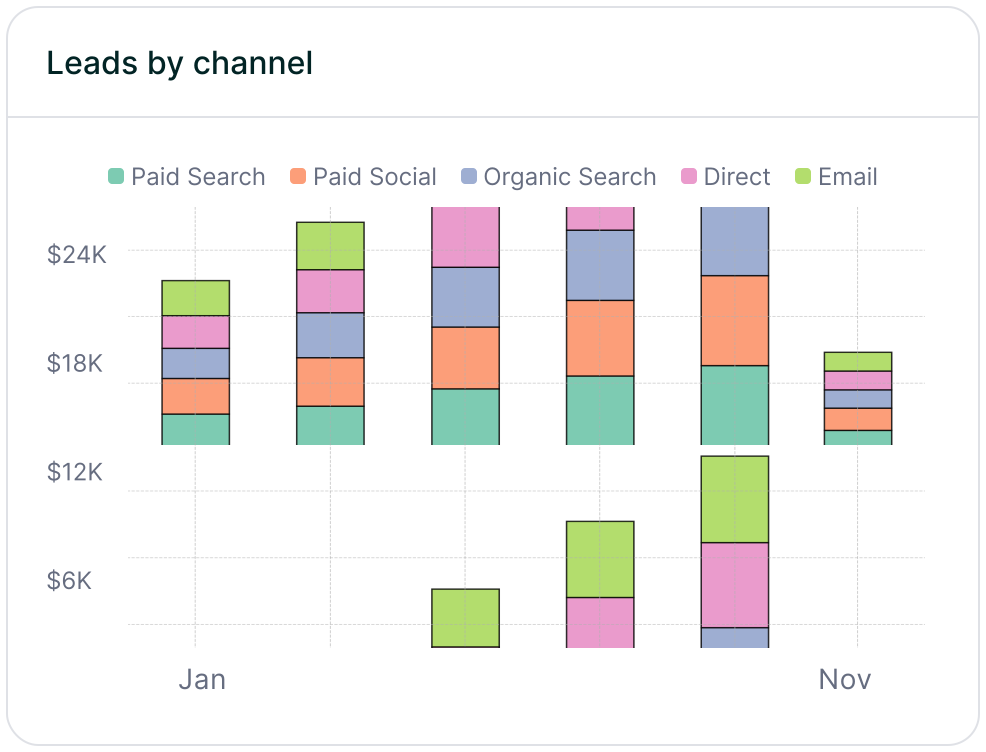
Leads by channel
Compare lead generation across Paid Search, Paid Social, Organic Search, Email, Referral, and Direct traffic. This makes it easier to understand how Google Ads contributes to overall pipeline generation alongside other marketing channels.
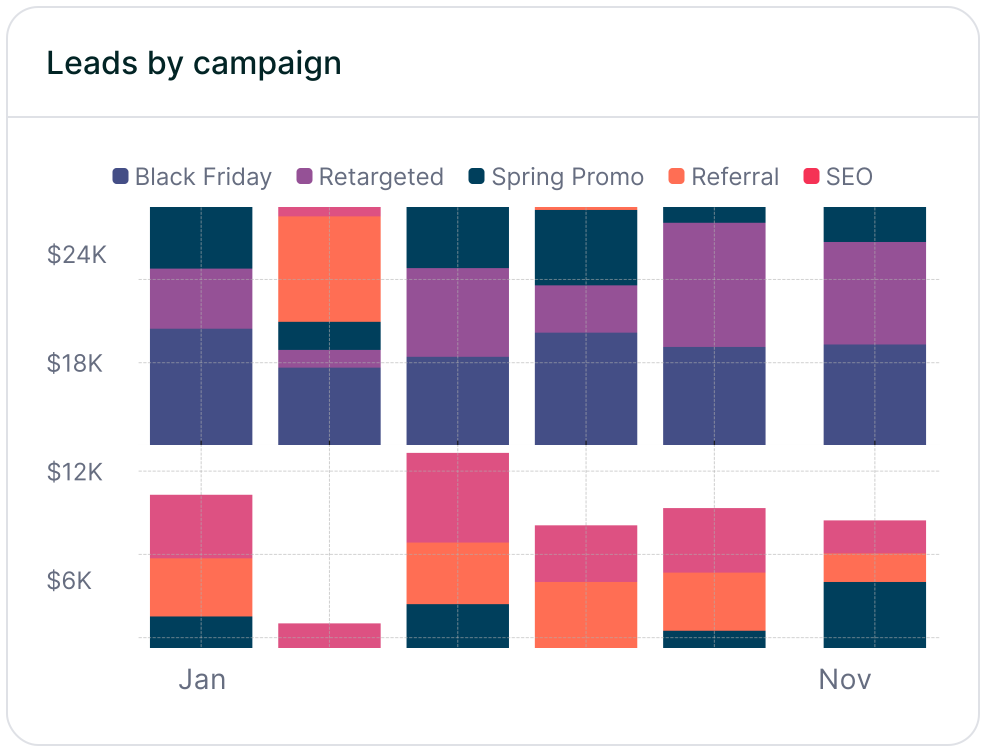
Leads by campaign
Track which Google Ads campaigns generate the highest volume of qualified leads. Campaign-level reporting helps marketers compare targeting strategies, offers, ad groups, and messaging performance across campaigns.
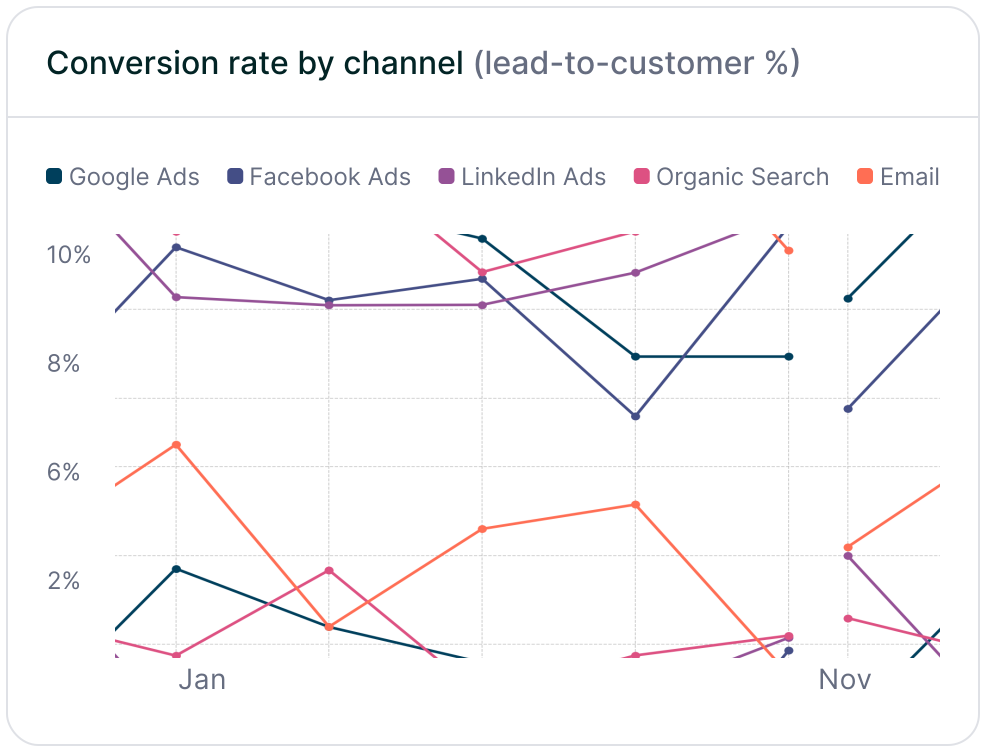
Conversion rate by channel
Measure which traffic sources convert leads into paying customers most effectively. Some channels may generate high lead volume but low conversion quality, while others consistently produce higher-value customers and stronger revenue performance.
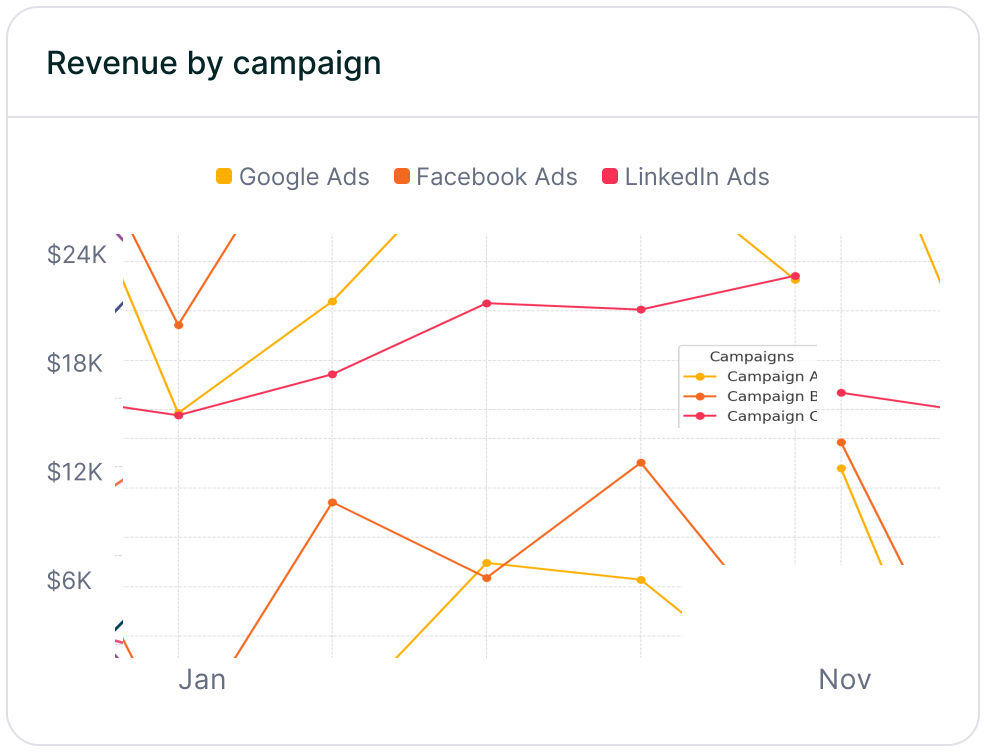
Revenue by campaign
Connect attribution data to customer and revenue outcomes to identify which Google Ads campaigns are driving actual business growth. This makes it easier to optimize budget allocation, scale high-performing campaigns, and identify underperforming spend before it impacts revenue.
Looking for a better way to understand which Google Ads campaigns are generating leads, customers, and revenue? Madlitics helps marketing teams capture attribution data directly inside Webflow submissions so campaign performance can be measured far beyond clicks and traffic alone.
Instead of relying on disconnected reporting or incomplete attribution data, Madlitics preserves Google Ads attribution from the first click through the final conversion. Campaign, keyword, landing page, channel, and click ID data stay attached to the lead, making it much easier to understand which campaigns are actually driving qualified customers and business growth.
With attribution data flowing directly into your CRM, reporting tools, and downstream workflows, teams can build clearer reports, optimize campaigns more confidently, improve lead quality analysis, and connect Google Ads spend to actual revenue outcomes. Sales teams gain better lead context, marketing gains stronger reporting, and leadership gains clearer visibility into marketing performance.
If you want a clearer picture of which Google Ads campaigns are actually generating leads, customers, and revenue, Madlitics gives you the attribution visibility needed to make smarter marketing decisions and scale what works.
Answers to common questions about Google Ads tracking with Madlitics and Webflow