Digital Marketing

Ultimate Guide to Revenue Attribution: Models, Examples & Best Practices

Understand how revenue attribution connects every marketing touchpoint to sales, helping you uncover which channels actually drive growth.
Attribution is broken

Revenue attribution is about identifying which marketing and sales efforts generate revenue. It connects customer interactions - like ads, emails, or social posts - to actual revenue, helping businesses see which channels work and which don’t. This is especially important for complex B2B journeys involving multiple touchpoints over weeks or months.

Here’s why it matters:

  • Pinpoints high-performing channels.
  • Reduces wasted ad spend.
  • Tracks key metrics like CAC (Customer Acquisition Cost) and ROAS (Return on Ad Spend).

Common Attribution Models:

  • First-Touch: Credits the first interaction. Good for tracking brand awareness.
  • Last-Touch: Credits the final interaction. Works for short sales cycles.
  • Linear: Distributes credit equally across all touchpoints.
  • U-Shaped: Prioritizes first and last interactions (40% each), with 20% for mid-funnel efforts.
  • Time Decay: Gives more credit to recent touchpoints, ideal for long sales cycles.

To get started, you need:

  1. Tracking: Use UTM tags and hidden form fields along with identity resolution to follow customer journeys.
  2. Data Integration: Sync marketing data with CRMs and payment systems.
  3. Analysis: Evaluate campaign ROI and track assisted conversions for a clearer picture.

Tools like Madlitics simplify this by linking all traffic sources - paid, organic, and direct - to revenue. It ensures accurate tracking, data standardization, and integration with CRMs like Salesforce or HubSpot. Setting it up is easy, and it helps businesses make data-driven decisions to optimize marketing spend.

Revenue Attribution Models

Choosing the right attribution model is key to accurately assigning revenue credit throughout the customer journey. Each model has its strengths and weaknesses, and the best choice will depend on your sales cycle and business goals. Here's a breakdown of the most common models:

First-touch attribution assigns all credit to the very first interaction a customer has with your brand. This model is great for measuring brand awareness and identifying which channels bring prospects into your funnel. However, it overlooks everything that happens after the initial interaction, such as nurturing or closing efforts.

Last-touch attribution gives all the credit to the final touchpoint before conversion. It's often the default option in analytics tools and works well for short sales cycles where the last interaction drives the purchase. The downside? It tends to overemphasize bottom-funnel channels like branded search or retargeting, while ignoring earlier efforts that created awareness.

Linear attribution evenly distributes credit across every touchpoint in the customer journey. For instance, if a customer interacts with five campaigns before converting, each campaign gets 20% of the credit. While this model gives a balanced view, it doesn't differentiate between low-intent actions (like reading a blog) and high-intent ones (like signing up for a demo).

U-shaped attribution allocates 40% of the credit to the first interaction and 40% to the final interaction, with the remaining 20% spread across the middle touchpoints. This model is popular in B2B lead generation because it rewards both the channel that discovered the lead and the one that closed the deal, though it gives less weight to mid-funnel activities.

Time decay attribution focuses more on touchpoints closer in time to the conversion. Using a half-life approach (typically around seven days), it gives more credit to recent interactions. It's ideal for long sales cycles where intent builds over time, but it can undervalue the initial touchpoint that started the journey.

Model

Best For

Primary Limitation

First-Touch

Brand awareness and top-of-funnel discovery

Ignores subsequent nurturing and conversion efforts

Last-Touch

Short sales cycles and closing campaigns

Over-credits bottom-funnel channels like branded search and retargeting

Linear

Journeys where every touch is valued

Treats low-intent and high-intent interactions equally

U-Shaped

Lead generation with clear discovery and conversion phases

May understate the impact of mid-funnel interactions

Time Decay

High-consideration purchases where recent actions drive decisions

Undervalues the initial discovery touchpoint

The best model depends on your unique needs. If you're focused on performance marketing with a short sales cycle, last-touch attribution might work well. On the other hand, B2B companies with longer, more complex journeys might benefit from U-shaped or linear models. For businesses handling high conversion volumes - typically 1,000 or more per month  - data-driven attribution is worth exploring. This approach uses machine learning to analyze customer behavior and assign credit accordingly.

How Revenue Attribution Works

Revenue attribution connects your marketing efforts to the revenue they generate. It boils down to three main steps: tracking customer interactions, tying those interactions to revenue, and evaluating which campaigns actually contribute to your bottom line.

Tracking Customer Journey Touchpoints

The first step is documenting every interaction a customer has with your brand. This often starts with capturing UTM parameters - tags added to your marketing links that tell you where a visitor came from. For example, if someone clicks on a LinkedIn ad or an email link, UTM tags capture that source.

But UTM tracking alone won’t cut it. With over 60% of online transactions involving multiple devices, you’ll need identity resolution to piece together a fragmented customer journey. This means recognizing the same person across different devices, sessions, and channels.

Hidden form fields are another key tool here. When someone fills out a lead form, these invisible fields automatically capture attribution details - like the campaign name, channel, or landing page - and feed them directly into your CRM. This eliminates manual errors and ensures every lead is tagged with its full marketing context. Plus, persistent data tracking ensures attribution sticks across sessions. So, if a customer clicks on a LinkedIn ad today but converts days later, you’ll still know where they came from.

Mapping Revenue to Touchpoints

Once you’ve tracked the interactions, the next step is connecting them to revenue. This involves unified data collection, which means pulling together data from multiple sources into one central system. Syncing marketing data with tools like your CRM or payment platforms (Stripe, PayPal, Chargebee) helps you link campaigns to closed deals.

From there, you’ll use an attribution model - such as first-touch, last-touch, linear, or U-shaped - to divide revenue credit among the touchpoints that influenced a conversion.

Data normalization is critical at this stage. Without it, inconsistent naming conventions (like "Paid-Social" vs. "paid_social") can mess up your reporting. Automated normalization ensures all your campaign data is grouped correctly, giving you a clean and accurate view of performance.

Analyzing Campaign Contributions

Now that revenue is tied to specific touchpoints, you can assess which campaigns are driving real results. But it’s not just about counting conversions. You’ll also need to factor in cost data from platforms like Google, LinkedIn, and Meta to calculate your true return on investment (ROI). Without cost data, a campaign could look like a revenue driver while actually losing money.

"The primary problem that most marketers run into is they've actually never seen attribution that works…anything that uses Google Tag Manager or the Google infrastructure doesn't provide transparency. You can't see cost - ever." - Ryan Koonce, CEO, Attribution

To get a fuller picture, track assisted conversions, which measure how often a channel played a supporting role in a conversion, even if it wasn’t the first or last click. Channels with high assistance rates often play a crucial role in nurturing leads through the funnel. Comparing different attribution models can also highlight undervalued channels.

For businesses with longer sales cycles, cohort-based evaluation is invaluable. Instead of looking at revenue in isolated monthly chunks, group customers by their first interaction date and track how much revenue they generate over time. This approach reflects the reality that e-commerce shoppers typically visit a site 3 to 5 times before making a purchase.

Using Madlitics for Revenue Attribution

Madlitics takes revenue attribution to the next level by seamlessly connecting attribution data with your CRM, giving you a clear view of every stage in the customer journey.


By consolidating, organizing, and linking marketing data directly to your CRM, Madlitics provides a straightforward way to identify the factors driving your growth.

Complete Channel Coverage

Most tools focus only on tracking paid campaigns, leaving gaps in understanding where much of your traffic originates. Madlitics changes that. It captures all visitor traffic - including organic search, social media, referrals, and direct visits - not just clicks from paid ads. Even when visitors arrive without UTM parameters, Madlitics automatically assigns them to the right channels.

This means you can finally track the entire customer journey. If you're only looking at paid clicks, you're only seeing part of the story. Madlitics ensures every conversion is recorded, giving you a complete understanding of how customers are finding you.

Persistent Attribution

One of the standout features of Madlitics is its ability to maintain the original source across multiple sessions. For example, if a visitor clicks on a LinkedIn ad, explores your site, and later converts, the platform ensures the LinkedIn ad remains credited. This gives your sales team the full context of how that lead originated.

Auto-Cleaned Data and Landing Page Insights

Madlitics takes care of messy data by automatically standardizing campaign names (e.g., combining variations like "Paid-Social" and "paid_social"). It also captures landing page data for every form submission, linking user actions to the content they engaged with.

This feature helps you pinpoint which blog posts, case studies, or pricing pages are directly influencing revenue. By connecting form submissions to specific pages, you can clearly see which content is driving results.

Integration and Setup

Setting up Madlitics is straightforward. Simply add the code snippet and hidden fields (such as Channel, Platform, Campaign, and Landing Page) to your forms, and the data will automatically sync with your CRM.

Madlitics works smoothly with popular CRMs like HubSpot, Salesforce, and ActiveCampaign. It also integrates with payment platforms like Stripe, PayPal, and Chargebee, enabling you to track the entire journey from the first click to closed revenue. For custom reporting, you can export data to tools like Google Sheets, Looker Studio, or Airtable. Plus, the platform offers a 14-day free trial - no credit card required - so you can try it out without any risk.

Best Practices for Revenue Attribution

Getting revenue attribution right isn’t just about setting up a tracking tool. The real challenge lies in how you collect, organize, and connect your marketing data. Let’s break it down.

Ensure Clean and Reliable Data

Consistency is key when it comes to campaign tracking. For instance, using different UTM parameter labels like "Paid-Social" and "paid_social" can split what should be a single channel into multiple, messy buckets. To avoid this, always standardize your UTM parameters.

Stick to consistent naming conventions for fields like source, medium, and campaign. For example, if one campaign uses "facebook" and another uses "Facebook", your reports will show duplicate channels - making it harder to analyze performance accurately.

Automating data normalization is another must. Tools that clean and standardize attribution data before it hits your CRM can save you from hours of manual cleanup. For example, variations like "Facebook", "facebook", and "FB" will be grouped correctly, ensuring your reports stay accurate from the start.

Capture All Traffic Sources

If you’re only tracking UTM-tagged traffic from paid ads, you’re missing a big piece of the puzzle. Organic search, social media referrals, direct visits, and even word-of-mouth all play a role in the customer journey. Ignoring these channels can leave your data incomplete.

Privacy updates add another layer of complexity. For instance, Safari’s one-day cookie expiration often causes returning visitors to show up as new "Direct" traffic in analytics tools. Without proper tracking, a customer who initially clicks a LinkedIn ad, browses your site, and returns a few days later to convert might be wrongly attributed to "Direct" instead of "LinkedIn."

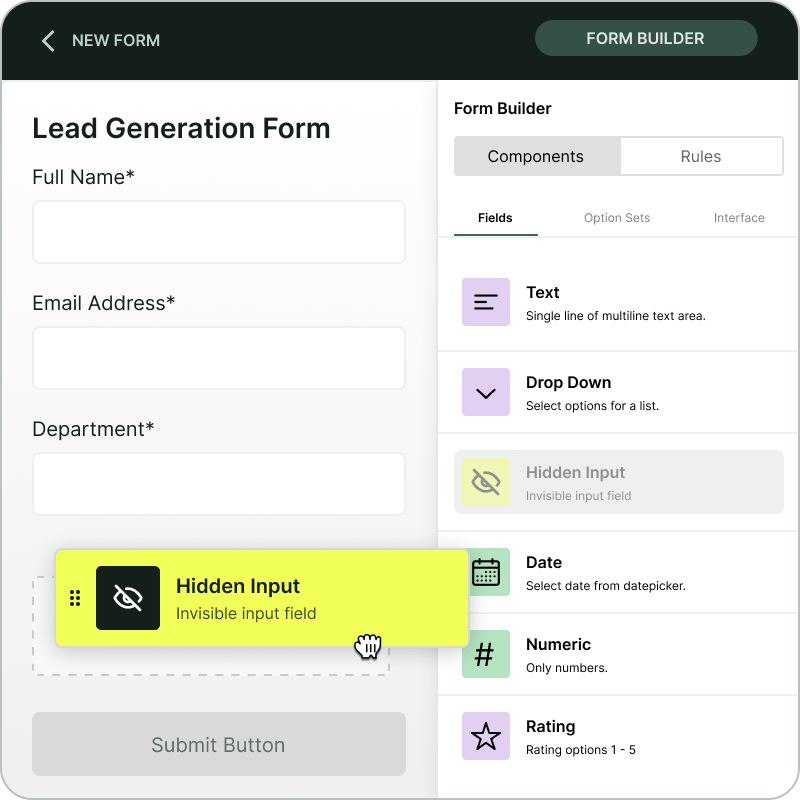
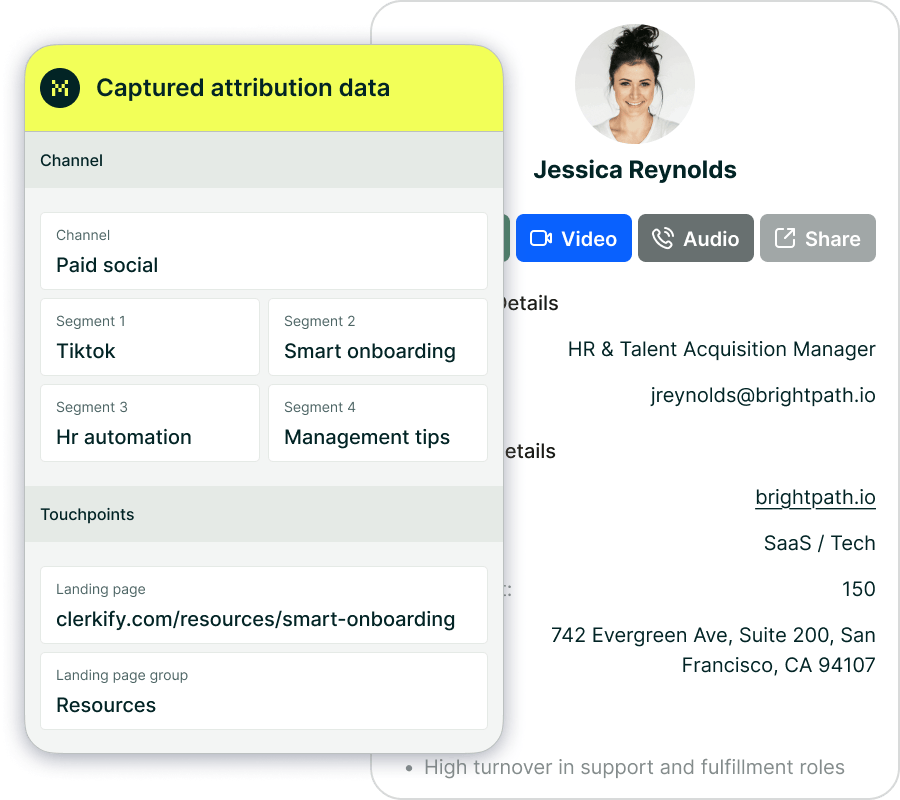
The solution? Use hidden form fields that capture attribution data the moment someone submits a form. These fields should include information like Channel, Campaign, Ad Group, and Landing Page. Pair this with persistent tracking that remembers a visitor’s original source across multiple sessions, and you’ll finally get a full view of how customers are finding you.

Of course, tracking traffic is only the first step. The real value lies in connecting that traffic to revenue.

Link Form Submissions to Revenue

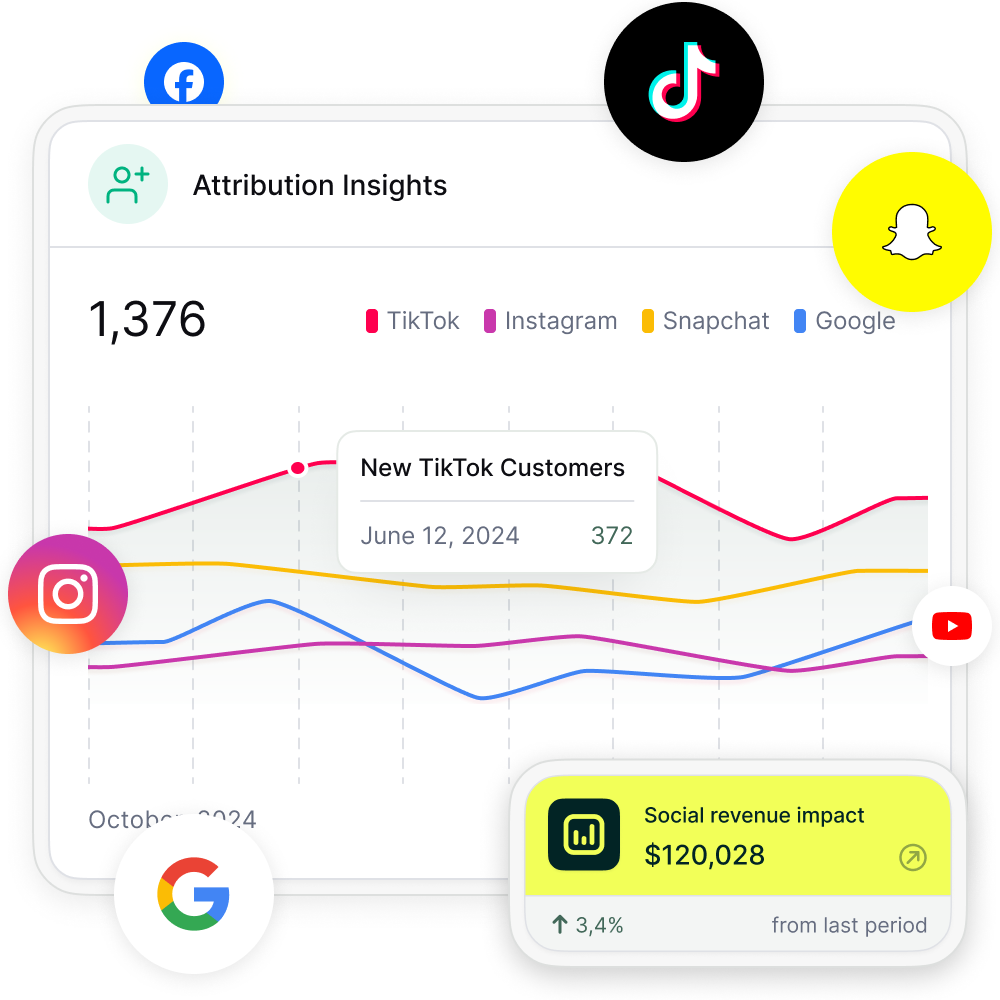
Comprehensive tracking sets the stage, but the next step is linking your data directly to revenue. After all, leads don’t mean much unless they convert into paying customers. Without this connection, it’s impossible to identify which campaigns are driving high-quality leads versus just generating clicks.

Take the example of Billy Footwear. By linking marketing data to revenue, they identified underused channels and reallocated their budget. The result? A 36% increase in revenue with just a 7% rise in ad spend.

To replicate this, sync your attribution data with your CRM and payment systems. Map hidden form fields to leads in platforms like Salesforce or HubSpot, and then connect those leads to payment processors such as Stripe or PayPal. This creates a full-circle view - from the first click to the final sale - showing exactly which campaigns are bringing in paying customers. Regular audits that compare attribution reports with bank records and pipeline data will help catch and fix any discrepancies along the way.

Madlitics multi-channel attribution visualization, showing marketing platforms like TikTok, Instagram, Google, and Facebook. The graphic highlights how different sources contribute to high-performing marketing channels.
1. Add UTM parameters to all inbound links
Any marketing effort that drives traffic — whether it’s a paid ad, an email campaign, or an organic post — should have properly structured URLs that clearly define the visitor’s origin. Setting it up is a straightforward process that starts with ensuring all inbound links include UTM parameters.

A LinkedIn campaign, for example, might link to:
https://yoursite.com/?utm_source=linkedin&utm_medium=paidsocial&utm_campaign=q1_promo
Screenshot of a form builder interface with a highlighted 'Hidden Input' field. Accompanied by text explaining how to install and set up Madlitics by adding hidden fields to capture marketing attribution data.
2. Add hidden fields
Once you’ve added UTM tracking to your inbound links, the next step is to install Madlitics on your site and update your Framer Forms to include hidden fields that will store attribution data when a visitor submits a form automatically. Hidden fields to include:
• Channel (e.g., Paid Search, Organic Social, Direct)
• Segment 1 (Platform name: Google, LinkedIn, Twitter)
• Segment 2 (Campaign name)
• Segment 3 (Ad group, offer name, or post type)
• Segment 4 (Creative type or ad variation)
• Landing page/group (Tracking & first-touch attribution)
CRM interface showing a detailed view of captured attribution data, including marketing channels, segments, and landing pages. A business profile of a lead is displayed, highlighting how Madlitics enriches lead data for sales and marketing teams.
3. Utilize attribution data
With the setup complete, every form submission in Framer now carries full attribution data, ensuring accurate insights into where leads originate. Pass this data to your CRM, analytics tools, or marketing automation platforms to track performance, refine campaigns, and optimize marketing efforts with precision.

Conclusion

This guide highlights how targeted revenue attribution can elevate marketing performance. As John Wanamaker famously said, "Half the money I spend on advertising is wasted; the trouble is I don't know which half". The strategies and models discussed here aim to replace marketing guesswork with data-driven decisions, connecting every touchpoint to actual revenue.

Different attribution models cater to varying business needs, especially for complex buyer journeys where customers often interact with 7 to 13 pieces of content before making a purchase. Success hinges on accurate data, thorough tracking, and linking submissions directly to revenue.

Madlitics simplifies this process by capturing every traffic source at the moment a form is submitted. It automatically normalizes UTM tags and retains attribution data across sessions. For example, if a visitor clicks a LinkedIn ad, explores your site, and returns days later to convert, Madlitics ensures the original source gets the credit. Plus, it integrates seamlessly with your CRM and payment processors, helping you pinpoint which campaigns bring in paying customers.

Getting started is straightforward: just add a code snippet and hidden form fields to begin collecting attribution data. With a 14-day free trial - no credit card required - you can quickly identify the channels driving real growth and decide where to focus your budget.

Revenue attribution isn't just about reporting; it empowers you to make confident, data-backed decisions that increase conversions, minimize wasted spend, and boost revenue. By adopting these practices, your business is better positioned for long-term growth.

Related articles to get you started with Madlitics

Visualizing your marketing impact
See how attribution data translates into actionable insights.
Stacked bar chart showing lead generation by marketing channel over time, comparing sources like Paid Search, Paid Social, Organic Search, Direct, and Email. Helps visualize which channels drive the most traffic.
Leads by channel
See how different marketing channels contribute to lead generation over time. Understand which ones drive the most traffic and whether your marketing mix is balanced. Shift your budget toward the highest-performing channels to maximize results.
Stacked bar chart illustrating lead volume across different marketing campaigns, including Black Friday, Retargeted, Spring Promo, Referral, and SEO. Highlights trends in campaign effectiveness.
Leads by campaign
Track inbound leads across all campaigns, whether or not they have UTM parameters. Ensure every lead is categorized correctly, including Organic and Referral traffic. Use this insight to refine messaging, targeting, and budget allocation for better performance.
Line chart displaying lead-to-customer conversion rates by channel, comparing Google Ads, Facebook Ads, LinkedIn Ads, Organic Search, and Email. Shows how different sources drive qualified leads over time.
Conversion rate by channel
See which channels convert leads into paying customers. Some bring buyers, while others generate unqualified leads. Focus your budget on what drives revenue.
Line chart showing revenue performance by marketing campaign, comparing Google Ads, Facebook Ads, and LinkedIn Ads. Helps identify top-performing and underperforming campaigns.
Revenue by campaign
Focus your budget on campaigns that drive revenue, not just leads. Identify top performers and optimize underperforming efforts to maximize profitability.

Frequently asked questions

Answers to your top questions about our UTM parameters
Put attribution data to work
Sync, analyze, and automate — turn insights into action.
Automation icon indicating hands-free marketing attribution and data flow.
Sync with your CRM
Pass UTM parameters into Salesforce, HubSpot, or ActiveCampaign so your sales team knows exactly where every lead came from — no more guessing.
Analytics report icon, indicating data insights and reporting.
Built smarter reports
Use Google Sheets, Looker Studio, or Airtable to create data-driven reports that reveal which campaigns drive real revenue — helping you make informed budget decisions.
Impact measurement icon, symbolizing marketing effectiveness.
Track revenue impact
Sync UTM data with Stripe, PayPal, or Chargebee to see which campaigns generate paying customers, not just leads — so you can scale what works.
Personalization icon, representing customization features.
Personalize email campaigns
Trigger personalized email flows in Klaviyo, Mailchimp, or ConvertKit based on a lead’s original source — ensuring the right message reaches the right audience.
Everything you need for reliable lead attribution
Accurate, persistent, and automated tracking — so your campaigns perform at their best.
Performance icon symbolizing marketing campaign effectiveness and results tracking.
Outperforms basic UTM tracking
Madlitics captures, categorizes, and persists attribution data across sessions, giving you a complete, structured view of what’s working in your marketing. Say goodbye to losing attribution when users navigate your site, struggling with formatting inconsistencies, and ingored non-UTM traffic.
Capture icon indicating data collection from various marketing channels and sources.
Capture all traffic
Madlitics categorizes all inbound leads — whether they have UTM parameters or not — so every conversion is accounted for, and you won't miss out on Organic Search, Organic Social, and Referral traffic.
Routing icon representing the flow of marketing data and attribution pathways.
Attribution across pages and sessions
A LinkedIn ad click should be attributed correctly—even if the visitor signs up on a different page later. If someone clicks an ad, browses multiple pages, then submits a form later, Madlitics persists attribution data across sessions, ensuring your reports reflect true performance.
List icon representing structured marketing data, reports, or campaign breakdowns.
Cleaner, more reliable data
Duplicate UTMs and inconsistent formatting break reports and mislead teams. Madlitics cleans and organizes attribution data before sending it to your CRM, giving you accurate insights.
Target icon symbolizing precise audience targeting and marketing campaign focus
See which content converts
Attribution isn’t just about where visitors came from—it’s about what convinced them to convert. By capturing landing page data alongside UTM parameters, Madlitics shows you which blog posts, case studies, or pricing pages drive the most revenue, helping you scale content that works.
Action icon representing campaign execution, optimization, and engagement.
Transform form submissions into actionable insights
Madlitics connects marketing touchpoints to lead generation, ensuring every form submission is fully attributed — optimize ad spend by identifying high-ROI channels, refine messaging based on what content drives engagement, make data-driven decisions with clean, structured reports, and more.