Digital Marketing

How Normalized Data Fixes Broken Multi-Channel Attribution

Learn how data normalization stops fragmented tracking, powers accurate multi-touch attribution, and turns scattered first-party signals into clear, revenue-backed insights across every channel.
Attribution is broken

Fragmented data hurts your marketing insights. When platforms use inconsistent tags, metrics, or formats, it becomes difficult to track which channels truly drive conversions. Normalization solves this by standardizing data across all channels, ensuring accuracy and consistency.

Here’s why normalization matters:

  • It prevents data fragmentation, ensuring accurate attribution.
  • It fixes issues like lost UTM parameters or duplicate conversions.
  • It powers multi-touch attribution models, offering a clear view of customer journeys.
  • It helps you comply with privacy regulations by organizing first-party data.

For example, MarketFlow found that Google Ads were over-credited by 26% under last-click attribution. After switching to normalized multi-touch attribution, they reallocated budgets and increased monthly revenue by $208,000.

The takeaway? Normalized data ensures your reports are reliable, helping you make smarter decisions about where to invest your marketing dollars.

What Data Normalization Is and Why It Matters

Defining Data Normalization

Data normalization is the process of organizing, cleaning, and standardizing data formats and naming conventions across different platforms. Think of it as creating a shared "language" for your marketing data.

Why does this matter? Because platforms often measure the same metric differently. For example, one platform might count a "view" after three seconds, while another requires ten seconds. Without normalization, these discrepancies can lead to confusion and inconsistent reporting. By standardizing this data, normalization ensures accuracy and consistency, helping to solve critical reporting challenges.

How Normalization Fixes Data Accuracy Problems

Normalization isn't just about tidying up your data - it actively solves common accuracy issues.

Without it, your reports can become fragmented and unreliable. Imagine trying to analyze performance when different platforms use inconsistent tags or formats. Normalization steps in to convert these inconsistencies into a unified format, creating a seamless flow of data.

One major issue normalization addresses is the loss of attribution context. For example, as users navigate multiple sessions or pages, critical details like UTM parameters or the original traffic source can get lost in custom forms. This often leads to leads being mislabeled as "Direct/None" in your CRM, even when they came from specific campaigns. Normalization ensures data remains intact throughout the customer journey, preserving attribution accuracy.

It also prevents duplicate conversions by consolidating unique transaction IDs. Without this, the same sale could be credited to multiple channels, inflating your metrics and distorting performance insights. By eliminating data fragmentation and duplicates, normalization strengthens the credibility of your attribution models.

Main Benefits for Multi-Channel Attribution

When it comes to multi-channel attribution, normalized data is a game changer.

Clean, standardized data provides a reliable foundation for your attribution models. Instead of grappling with fragmented, session-based data, you get a clear view of which channels are driving revenue. It’s like comparing apples to apples, giving you actionable insights.

Normalization also bridges the gap between marketing touchpoints and CRM records. This means you can directly connect your marketing efforts to revenue, not just anonymous traffic. With this clarity, you can confidently answer the all-important question: "Which channel actually brought in this customer?"

How Normalized Data Enables Multi-Touch Attribution

Once your data is normalized, you can finally trust more advanced models, to guide real budget decisions instead of guesswork. Normalization is the foundation; multi-touch attribution is one of the  ways to turn that clean data into better cross-channel strategy. Multi-touch attribution thrives on clean, consistent data. Without normalized data, it’s nearly impossible to track a customer’s journey accurately from the first interaction to the final conversion.

For example, inconsistent naming conventions can fragment your data, making it hard to connect the dots between touchpoints. Normalized data solves this by standardizing information, ensuring that every interaction - no matter how far apart - remains linked. This is especially critical in B2B sales cycles, which often stretch over 30 to 90 days.

MarketFlow, a marketing analytics SaaS company, experienced this firsthand in September 2025. Their CMO, David Chen, discovered how last-click attribution skewed their perception of performance. Initially, their data suggested that Google Ads drove 44% of revenue, amounting to $387,000. But after implementing a normalized time-decay multi-touch model, they found that Google Ads contributed just 18% ($158,000). Content and SEO, previously thought to account for 23% of revenue, were actually responsible for 42% ($369,000). By reallocating $18,000 per month from ads to content, MarketFlow increased conversions by 23% and boosted monthly revenue from $879,000 to $1.087 million in just three months.

"Last-click showed Google Ads delivering 47% of our pipeline. We kept increasing ad spend. When we implemented multi-touch attribution, we discovered content/SEO was actually responsible for 64% of deals." - David Chen, CMO, MarketFlow

This example highlights how normalized data can completely reshape attribution insights.

Platforms like Madlitics simplify this process by automatically cleaning and standardizing data. They ensure that attribution models maintain context across sessions, giving marketers a clear and reliable view of performance.

Attribution Model Comparison

Different attribution models suit different goals, but all rely on data quality to deliver accurate results. Here’s a quick comparison of some common models:

Attribution Model

Best Used For

Limitations

Data Quality Requirements

Last Click

Simple B2C impulse buys

Ignores the full customer journey; over-credits the final touchpoint

Low; only needs the final URL

First Click

Pure awareness campaigns

Disregards subsequent interactions and conversion steps

Low; only needs the initial URL

Linear

Basic multi-touch overviews

Treats all interactions equally

Medium; requires tracking of all touchpoints

Time Decay

B2B SaaS with 30–90 day sales cycles

Requires choosing an arbitrary decay rate

High; requires normalized data

Position-Based

Campaigns balancing awareness and conversion

May undervalue middle-funnel interactions

High; requires normalized data

Data-Driven

Large-scale operations (10,000+ conversions)

Uses complex black-box logic

Very High; relies on extensive, clean datasets

As attribution models become more advanced, their need for clean, normalized data grows. Models like time-decay, position-based, and data-driven attribution depend heavily on reliable datasets. For B2B teams managing long sales cycles, a time-decay model with a 14-day half-life often strikes the right balance between recognizing early touchpoints and the final conversion-driving actions.

Platforms like Madlitics simplify this entire process by automatically cleaning and standardizing your marketing data as it’s captured, then persisting attribution across sessions and forms. With normalization handled for you, your multi-touch attribution models maintain context across channels and time, giving marketers a clear, reliable view of performance they can use to reallocate spend with confidence.

Data Normalization in a Privacy-First Environment

How Privacy Regulations Changed Attribution

Privacy laws like GDPR and CCPA have reshaped how marketers handle data collection and attribution. These regulations require personal information to be accurate, relevant, and current, which directly impacts the quality of attribution efforts. Without normalized data, meeting these standards while maintaining reliable tracking becomes a real challenge.

The stats highlight the shift: 74% of consumers place a high value on data privacy, and 82% are deeply concerned about how their data is used. This heightened awareness has forced marketers to move away from third-party cookies, which previously tracked users across the web without explicit consent. Now, 78% of companies let customers control their own data, meaning attribution models must rely on consent-based, first-party data. Normalizing this data is now more important than ever to ensure effective tracking in this privacy-conscious landscape.

Using First-Party Data with Normalization

First-party data - collected from website visits, CRM systems, and email interactions - forms the backbone of modern attribution. But here's the catch: user identities often fragment across platforms, making it difficult to connect the dots. That’s where normalization steps in, consolidating these scattered touchpoints into a unified timeline.

For example, imagine a user clicks a LinkedIn ad, explores a pricing page, and fills out a form days later. Without third-party cookies, these actions might seem unrelated. However, normalization links them to the same individual, creating a complete picture of their journey. Tools like Madlitics simplify this process by cleaning and organizing data automatically. This approach ensures that even when users browse extensively before converting, the full marketing context remains intact, strengthening multi-channel attribution in a privacy-first world.

Reducing the Impact of Lost Tracking Signals

The decline of third-party cookies has led to significant signal loss as browsers tighten tracking restrictions. In fact, over one-third of marketers report diminished measurement capabilities. This is where normalization becomes a game-changer, helping to standardize first-party data and fill in the gaps left by incomplete tracking signals.

For instance, normalized data can integrate inputs like form submissions, CRM updates, and server-side events to create a cohesive view of customer interactions. The results speak for themselves: Google Store saw a 35% boost in return on ad spend by adopting advanced attribution models built on normalized customer journey data. Similarly, Heineken achieved a 15% sales increase by combining normalized online and offline data to pinpoint key touchpoints. By addressing these tracking gaps, normalization ensures that multi-channel attribution models remain reliable in a privacy-focused environment.

The takeaway is clear: attribution isn’t just about modeling anymore - it’s also a matter of managing data effectively. Without a unified, normalized data structure, even the most advanced AI models risk producing what experts call "plausible-looking fiction". Normalization not only bridges tracking gaps but also enhances the trustworthiness of attribution models, ensuring they rely on reconciled, accurate data rather than fragmented reports that lead to unreliable conclusions.

How to Implement Data Normalization

Creating Standard Data Schemas

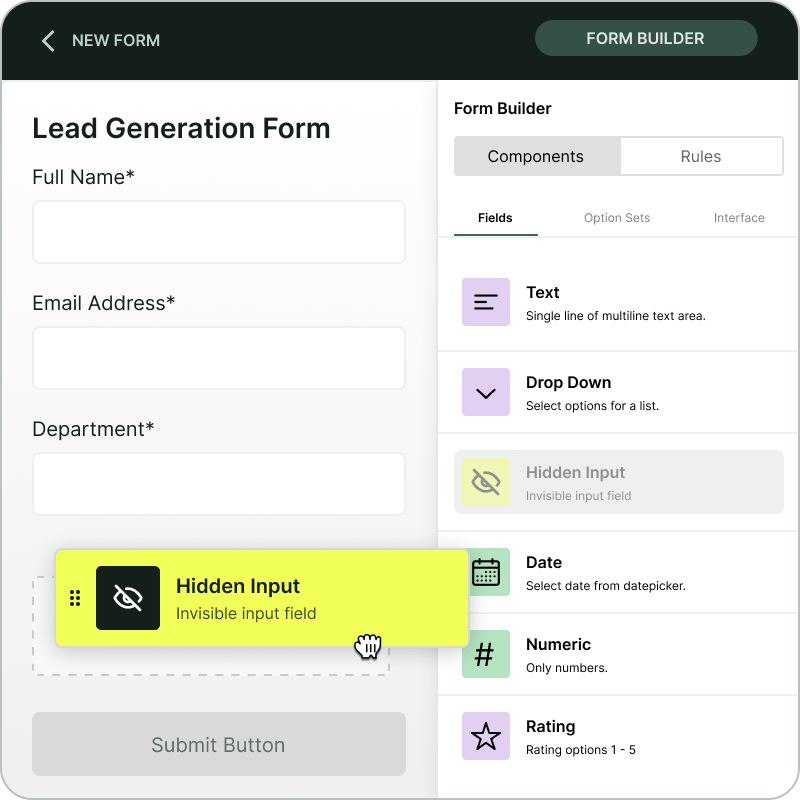
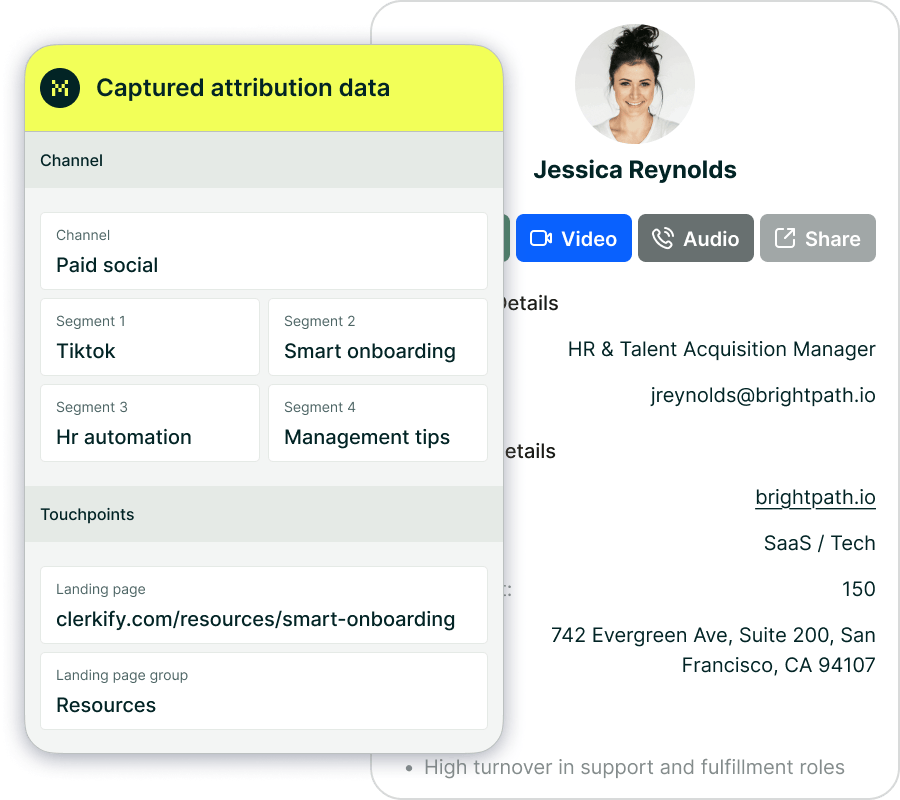
Reliable attribution starts with consistent naming conventions across all marketing channels. When tags are inconsistent, reports get split into multiple categories, quickly making the data unreliable. A well-designed schema should break attribution into clear segments, such as Channel (e.g., Paid Search), Platform (e.g., Google), Campaign Name, Ad Group or Offer, and Creative Variation. This ensures that every inbound link - whether from a paid ad, email campaign, or organic post - follows the same structure. Decide on specific rules, like using hyphens instead of underscores or sticking to lowercase characters, and document these standards for your team.

Hidden form fields play a crucial role here. Embedding these fields in forms helps capture UTM and session data. Once collected, this data should map directly to corresponding fields in your CRM, allowing attribution data to flow seamlessly without needing manual fixes.

By standardizing schemas, you lay the groundwork for automation, which ensures data consistency as it moves into your CRM.

Using Automation to Normalize Data

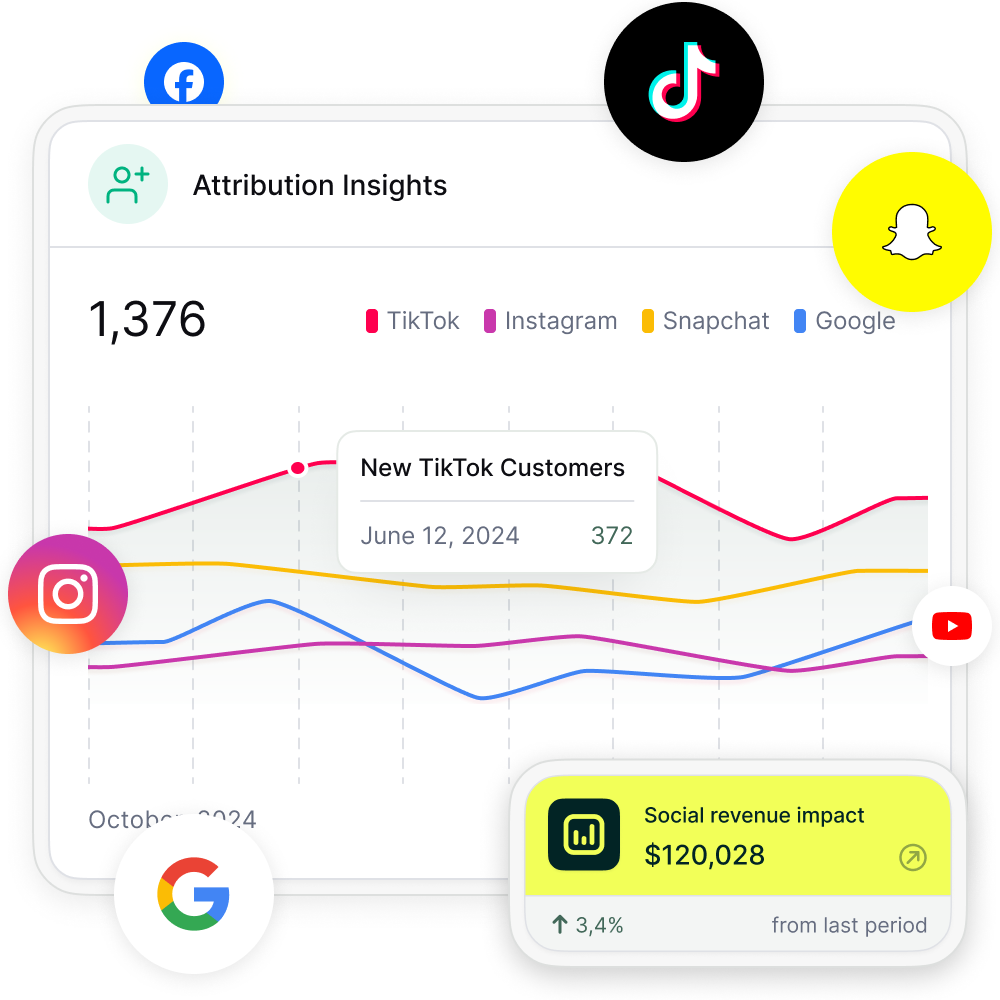
Manual data entry often leads to inconsistencies, like "Facebook" being entered as "FB", which fragments your data. Automation tools solve this issue by aligning naming conventions before the data even reaches your CRM. Automated capture layers can track and maintain attribution data across multiple pages and sessions, preserving the original source of traffic. Tools like Madlitics streamline this process by automatically organizing and normalizing marketing data as it's collected.

AI and machine learning take automation a step further by dynamically weighting touchpoints based on real user behavior instead of static rules. For example, Microsoft Store achieved a 10% boost in sales by using machine learning-based attribution to zero in on high-performing channels. Automation not only saves time but also delivers a level of accuracy that manual processes simply can't match.

Setting Up Data Governance Rules

Once you’ve standardized schemas and automated data normalization, robust governance ensures that your data remains accurate over time. Start by enforcing universal tagging requirements - every link, whether it’s paid or organic, should use a structured URL that clearly identifies the visitor's source.

Regular audits are essential. Schedule checks for tags, pixels, and cookies to spot any discrepancies between ad platforms and your internal analytics. This process ensures attribution data remains consistent across sessions. For instance, if a user clicks an ad but converts later via a direct visit, your governance rules should maintain the original source.

Privacy compliance is another critical aspect. Your governance framework must include clear protocols for collecting first-party data through opt-in mechanisms to stay compliant with GDPR and CCPA regulations. Additionally, identity resolution protocols should be in place to recognize customers across devices, browsers, and accounts, creating a unified view of their journey. Governance rules work hand-in-hand with automated normalization, continuously monitoring data quality across channels. This approach ensures your attribution data is reliable and defensible, even as privacy regulations evolve.

Madlitics multi-channel attribution visualization, showing marketing platforms like TikTok, Instagram, Google, and Facebook. The graphic highlights how different sources contribute to high-performing marketing channels.
1. Add UTM parameters to all inbound links
Any marketing effort that drives traffic — whether it’s a paid ad, an email campaign, or an organic post — should have properly structured URLs that clearly define the visitor’s origin. Setting it up is a straightforward process that starts with ensuring all inbound links include UTM parameters.

A LinkedIn campaign, for example, might link to:
https://yoursite.com/?utm_source=linkedin&utm_medium=paidsocial&utm_campaign=q1_promo
Screenshot of a form builder interface with a highlighted 'Hidden Input' field. Accompanied by text explaining how to install and set up Madlitics by adding hidden fields to capture marketing attribution data.
2. Add hidden fields
Once you’ve added UTM tracking to your inbound links, the next step is to install Madlitics on your site and update your Framer Forms to include hidden fields that will store attribution data when a visitor submits a form automatically. Hidden fields to include:
• Channel (e.g., Paid Search, Organic Social, Direct)
• Segment 1 (Platform name: Google, LinkedIn, Twitter)
• Segment 2 (Campaign name)
• Segment 3 (Ad group, offer name, or post type)
• Segment 4 (Creative type or ad variation)
• Landing page/group (Tracking & first-touch attribution)
CRM interface showing a detailed view of captured attribution data, including marketing channels, segments, and landing pages. A business profile of a lead is displayed, highlighting how Madlitics enriches lead data for sales and marketing teams.
3. Utilize attribution data
With the setup complete, every form submission in Framer now carries full attribution data, ensuring accurate insights into where leads originate. Pass this data to your CRM, analytics tools, or marketing automation platforms to track performance, refine campaigns, and optimize marketing efforts with precision.

Conclusion

Data normalization turns fragmented multi-channel attribution into a reliable framework for smarter decision-making. When your data is clean and consistent, it becomes much easier to pinpoint which marketing channels are generating actual revenue instead of just driving traffic. For instance, real-world examples have shown noticeable increases in both revenue and conversions when normalized data is applied.

This process not only clarifies attribution but also helps optimize your marketing budget. By identifying underperforming campaigns, normalization allows you to allocate resources more effectively. In a privacy-focused world - where third-party cookies are disappearing - leveraging first-party, opt-in data has never been more important. Normalized data ensures that consented information collected at the form level remains accurate and actionable, keeping your strategies compliant with GDPR and CCPA while delivering dependable attribution insights.

Aligning data across all touchpoints involves standardizing data schemas, automating data collection, and setting governance rules. These steps lay the groundwork for connecting marketing activities directly to revenue. When clean attribution data flows seamlessly from the first customer interaction to CRM records and ultimately to closed deals, your team can confidently focus on strategies that deliver results.

Normalization doesn’t just improve attribution accuracy - it reshapes how marketing teams operate. It eliminates guesswork and last-click bias, offering a complete view of the customer journey. This clarity helps you identify which channels deserve more investment and which ones are draining resources unnecessarily. With normalized data, you can stay compliant, allocate budgets wisely, and drive growth through informed, data-driven decisions.

Related articles to get you started with Madlitics

Frequently asked questions

Answers to your top questions about our UTM parameters
Put attribution data to work
Sync, analyze, and automate — turn insights into action.
Automation icon indicating hands-free marketing attribution and data flow.
Sync with your CRM
Pass UTM parameters into Salesforce, HubSpot, or ActiveCampaign so your sales team knows exactly where every lead came from — no more guessing.
Analytics report icon, indicating data insights and reporting.
Built smarter reports
Use Google Sheets, Looker Studio, or Airtable to create data-driven reports that reveal which campaigns drive real revenue — helping you make informed budget decisions.
Impact measurement icon, symbolizing marketing effectiveness.
Track revenue impact
Sync UTM data with Stripe, PayPal, or Chargebee to see which campaigns generate paying customers, not just leads — so you can scale what works.
Personalization icon, representing customization features.
Personalize email campaigns
Trigger personalized email flows in Klaviyo, Mailchimp, or ConvertKit based on a lead’s original source — ensuring the right message reaches the right audience.
Visualizing your marketing impact
See how attribution data translates into actionable insights.
Stacked bar chart showing lead generation by marketing channel over time, comparing sources like Paid Search, Paid Social, Organic Search, Direct, and Email. Helps visualize which channels drive the most traffic.
Leads by channel
See how different marketing channels contribute to lead generation over time. Understand which ones drive the most traffic and whether your marketing mix is balanced. Shift your budget toward the highest-performing channels to maximize results.
Stacked bar chart illustrating lead volume across different marketing campaigns, including Black Friday, Retargeted, Spring Promo, Referral, and SEO. Highlights trends in campaign effectiveness.
Leads by campaign
Track inbound leads across all campaigns, whether or not they have UTM parameters. Ensure every lead is categorized correctly, including Organic and Referral traffic. Use this insight to refine messaging, targeting, and budget allocation for better performance.
Line chart displaying lead-to-customer conversion rates by channel, comparing Google Ads, Facebook Ads, LinkedIn Ads, Organic Search, and Email. Shows how different sources drive qualified leads over time.
Conversion rate by channel
See which channels convert leads into paying customers. Some bring buyers, while others generate unqualified leads. Focus your budget on what drives revenue.
Line chart showing revenue performance by marketing campaign, comparing Google Ads, Facebook Ads, and LinkedIn Ads. Helps identify top-performing and underperforming campaigns.
Revenue by campaign
Focus your budget on campaigns that drive revenue, not just leads. Identify top performers and optimize underperforming efforts to maximize profitability.
Everything you need for reliable lead attribution
Accurate, persistent, and automated tracking — so your campaigns perform at their best.
Performance icon symbolizing marketing campaign effectiveness and results tracking.
Outperforms basic UTM tracking
Madlitics captures, categorizes, and persists attribution data across sessions, giving you a complete, structured view of what’s working in your marketing. Say goodbye to losing attribution when users navigate your site, struggling with formatting inconsistencies, and ingored non-UTM traffic.
Capture icon indicating data collection from various marketing channels and sources.
Capture all traffic
Madlitics categorizes all inbound leads — whether they have UTM parameters or not — so every conversion is accounted for, and you won't miss out on Organic Search, Organic Social, and Referral traffic.
Routing icon representing the flow of marketing data and attribution pathways.
Attribution across pages and sessions
A LinkedIn ad click should be attributed correctly—even if the visitor signs up on a different page later. If someone clicks an ad, browses multiple pages, then submits a form later, Madlitics persists attribution data across sessions, ensuring your reports reflect true performance.
List icon representing structured marketing data, reports, or campaign breakdowns.
Cleaner, more reliable data
Duplicate UTMs and inconsistent formatting break reports and mislead teams. Madlitics cleans and organizes attribution data before sending it to your CRM, giving you accurate insights.
Target icon symbolizing precise audience targeting and marketing campaign focus
See which content converts
Attribution isn’t just about where visitors came from—it’s about what convinced them to convert. By capturing landing page data alongside UTM parameters, Madlitics shows you which blog posts, case studies, or pricing pages drive the most revenue, helping you scale content that works.
Action icon representing campaign execution, optimization, and engagement.
Transform form submissions into actionable insights
Madlitics connects marketing touchpoints to lead generation, ensuring every form submission is fully attributed — optimize ad spend by identifying high-ROI channels, refine messaging based on what content drives engagement, make data-driven decisions with clean, structured reports, and more.