Learn which marketing attribution KPIs matter, how to calculate them, and how to use the data to optimize channels, budget, and revenue across the full customer journey.
Marketing attribution helps you understand which marketing efforts lead to results like purchases or leads. Without it, you risk wasting up to 40% of your budget on underperforming channels. This guide explains key attribution KPIs, common challenges, and how tools like Madlitics improve tracking accuracy.
Key Takeaways:
Attribution KPIs: ROAS, CAC, conversion rates, marketing ROI, and lead-to-customer rate help measure campaign performance.
Attribution Models: First-touch, last-touch, and time-decay models assign credit differently, impacting how KPIs are calculated.
Challenges: Data silos, incomplete tracking, and in-market bias can distort results.
Madlitics: Tracks all channels, maintains attribution across sessions, and integrates with CRMs to simplify data management.
Accurate attribution ensures smarter budget decisions and shows how marketing drives revenue.
Key Marketing Attribution KPIs
Understanding the right metrics can help you turn raw data into actionable strategies. These KPIs highlight which campaigns deserve more investment and which ones might be wasting resources. Let’s break them down.
Return on Ad Spend (ROAS)
ROAS tells you how much revenue you earn for every dollar spent on advertising. For example, if $1,000 spent on Facebook ads generates $4,000 in revenue, your ROAS is 4:1 (or 400%). This metric cuts through less helpful data like impressions and clicks, focusing instead on what truly drives revenue. It’s a powerful way to identify which ad creatives or keywords to scale up - or shut down immediately - based on performance.
Customer Acquisition Cost (CAC)
CAC shows how much it costs to acquire a single customer. Attribution plays a big role here by uncovering "revenue leaks", where budget gets wasted on underperforming channels. For instance, if your CAC is $150 but your customers only bring in $120 in lifetime value, you’re losing money on every sale. This metric helps you spot inefficiencies and adjust your strategy.
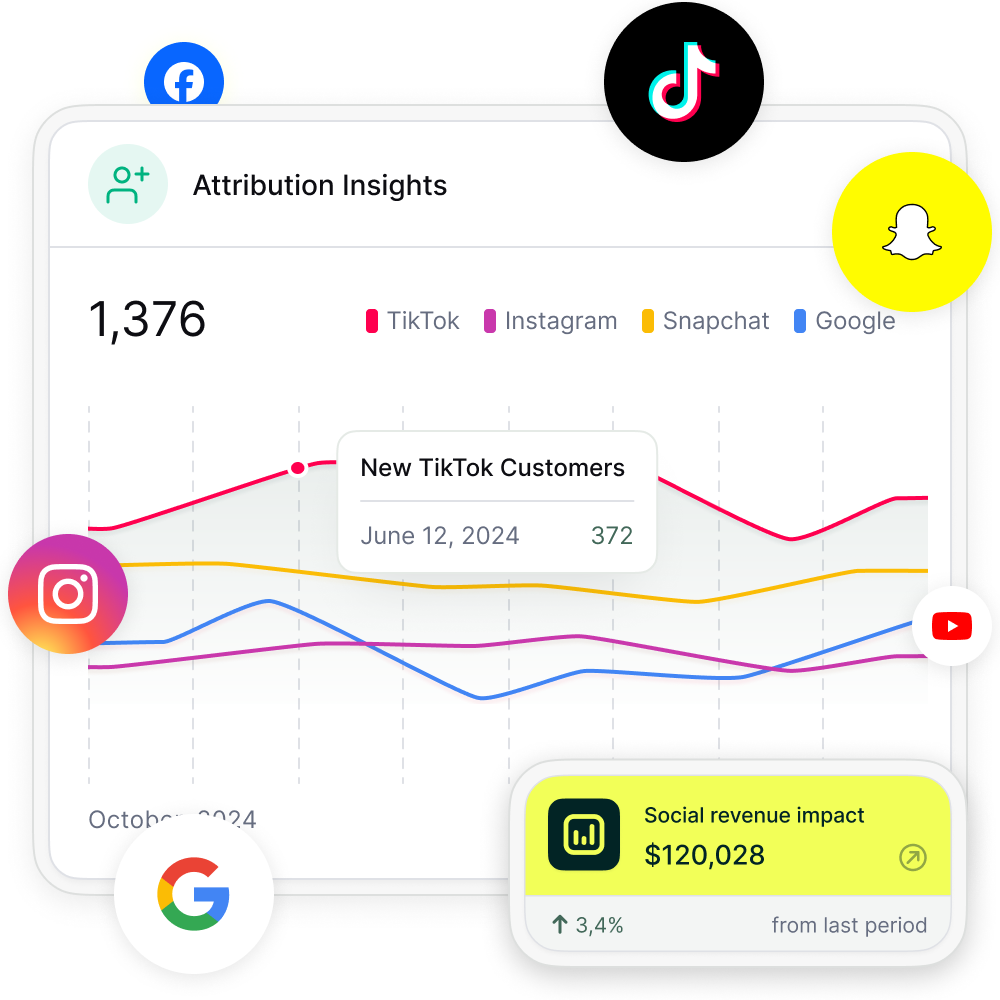
Conversion Rate by Channel
This KPI highlights which platforms - like organic search, paid social, email, or referrals - turn visitors into paying customers. Instead of just looking at traffic volume, conversion rates reveal where true value lies. For example, one channel might drive thousands of visitors but convert at a low 0.5%, while another brings fewer visitors but converts at 8%. Focusing on these rates helps you invest in channels that deliver better outcomes.
Marketing ROI
Marketing ROI ties your total marketing spend to actual profits. It’s calculated as (Revenue - Marketing Cost) / Marketing Cost. This metric simplifies complex tracking challenges into clear business outcomes, making it easier to justify budgets and show leadership how marketing drives growth. Top-performing teams achieve 85–95% attribution accuracy, while many others struggle with only 30–40%.
Lead-to-Customer Rate
This KPI tracks how many leads from specific sources turn into paying customers. It’s not just about lead volume - it’s about quality. For example, one channel might produce 500 leads with a 2% conversion rate, while another generates 100 leads with a 15% conversion rate. The second channel clearly delivers more valuable prospects. Monitoring this rate helps you identify which efforts lead to real growth and where potential customers drop off in the journey.
Attribution Models and KPI Calculations
Marketing Attribution Models Comparison: First-Touch vs Last-Touch vs Time-Decay
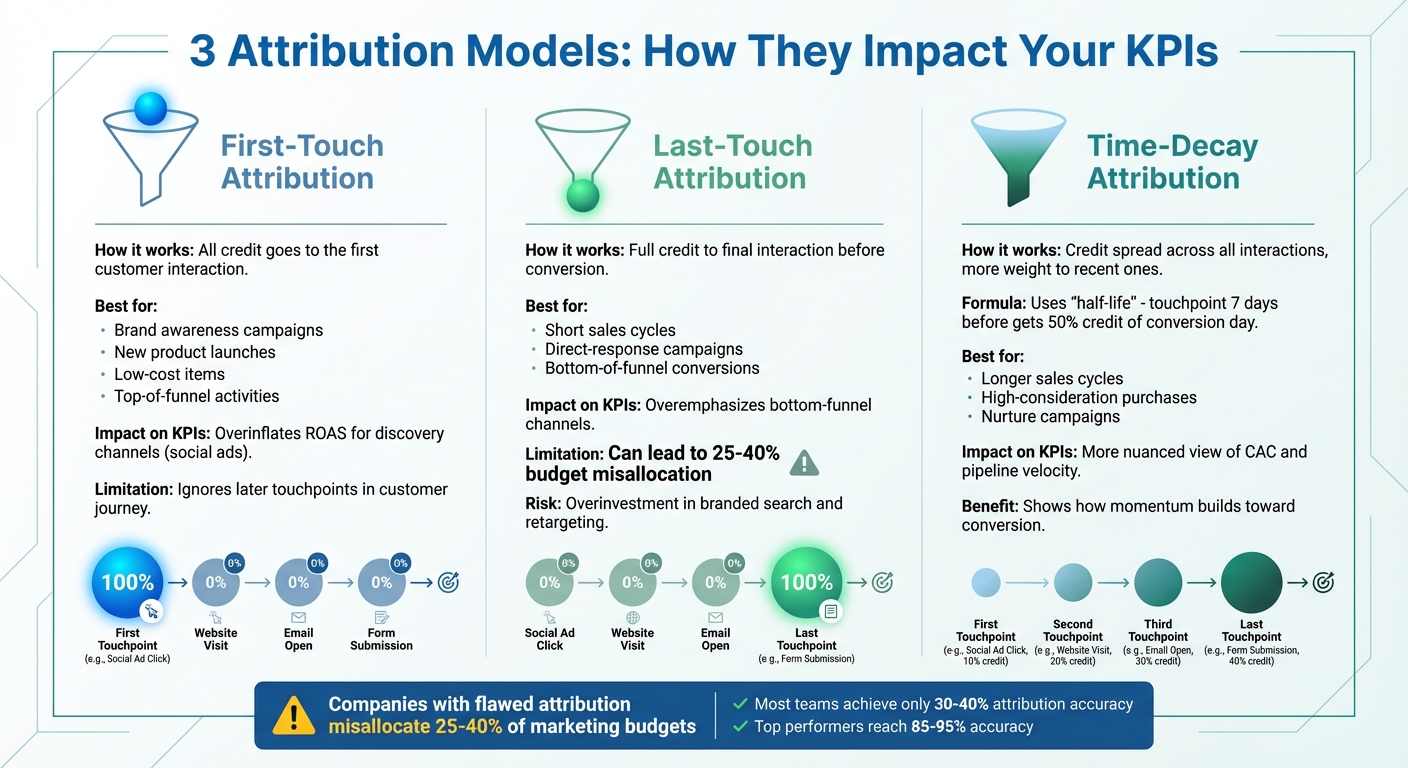
The way you attribute credit to marketing efforts can significantly impact your key performance indicators (KPIs). A channel that looks highly profitable in one model might seem inefficient in another. Understanding these differences is crucial for interpreting data correctly and making smart budget decisions. Let’s break down three common attribution models and how they influence KPIs.
First-Touch Attribution
In this model, all the credit goes to the very first interaction a customer has with your brand. It’s a great choice for assessing top-of-funnel activities like building brand awareness. This approach works well for businesses targeting new leads, launching new products, or selling low-cost items where that initial discovery plays a big role. However, it’s not without flaws - it tends to overinflate the Return on Ad Spend (ROAS) for discovery-focused channels like social ads while ignoring the impact of later touchpoints in the customer journey.
Last-Touch Attribution
Last-touch attribution gives full credit to the final interaction before a customer converts. It’s a default model for many platforms and is particularly useful for campaigns with short sales cycles or direct-response goals. It highlights which channel ultimately closed the deal, making it valuable for bottom-of-funnel KPIs like conversions. But, as Sushil Goel from LayerFive explains:
Last-touch models can overemphasize bottom-funnel channels, leading to overinvestment in branded search and retargeting at the expense of awareness channels.
This bias can result in companies misallocating 25–40% of their marketing budgets due to an over-focus on these final touchpoints.
Time-Decay Attribution
Time-decay attribution spreads credit across all interactions but gives more weight to those closer to the conversion. Using a "half-life" formula, it ensures recent touchpoints carry more influence. For example, a touchpoint seven days before a conversion might get half the credit of one on the actual conversion day. This model is especially useful for longer sales cycles, high-consideration purchases, or campaigns that require nurturing over time. It provides a more nuanced view of KPIs like Customer Acquisition Cost (CAC) and pipeline velocity, showing how momentum builds as prospects move closer to a decision.
Each of these models impacts KPI calculations differently, offering unique insights into how marketing efforts drive results. These distinctions lay the groundwork for diving into advanced tracking strategies with Madlitics in the next section.
Getting attribution right isn’t just about picking the best model - it’s about capturing clean, reliable data across every channel. The bigger challenge? Keeping track of every touchpoint without losing sight of where your leads came from. Companies with flawed attribution systems often misallocate 25–40% of their marketing budgets, and most teams only manage 30–40% accuracy.
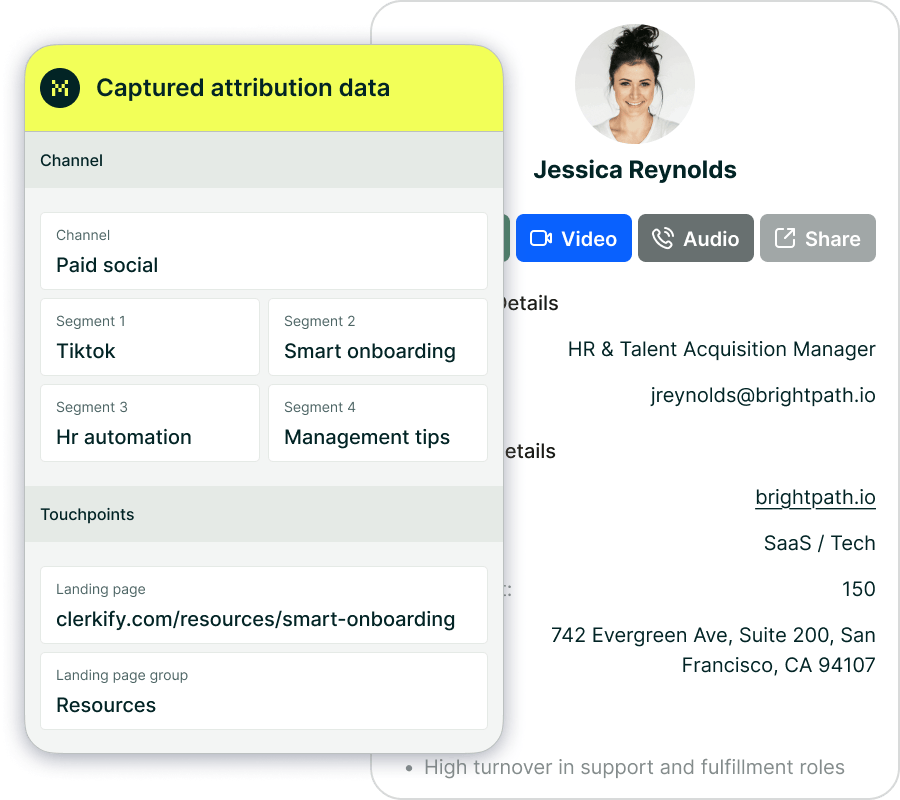
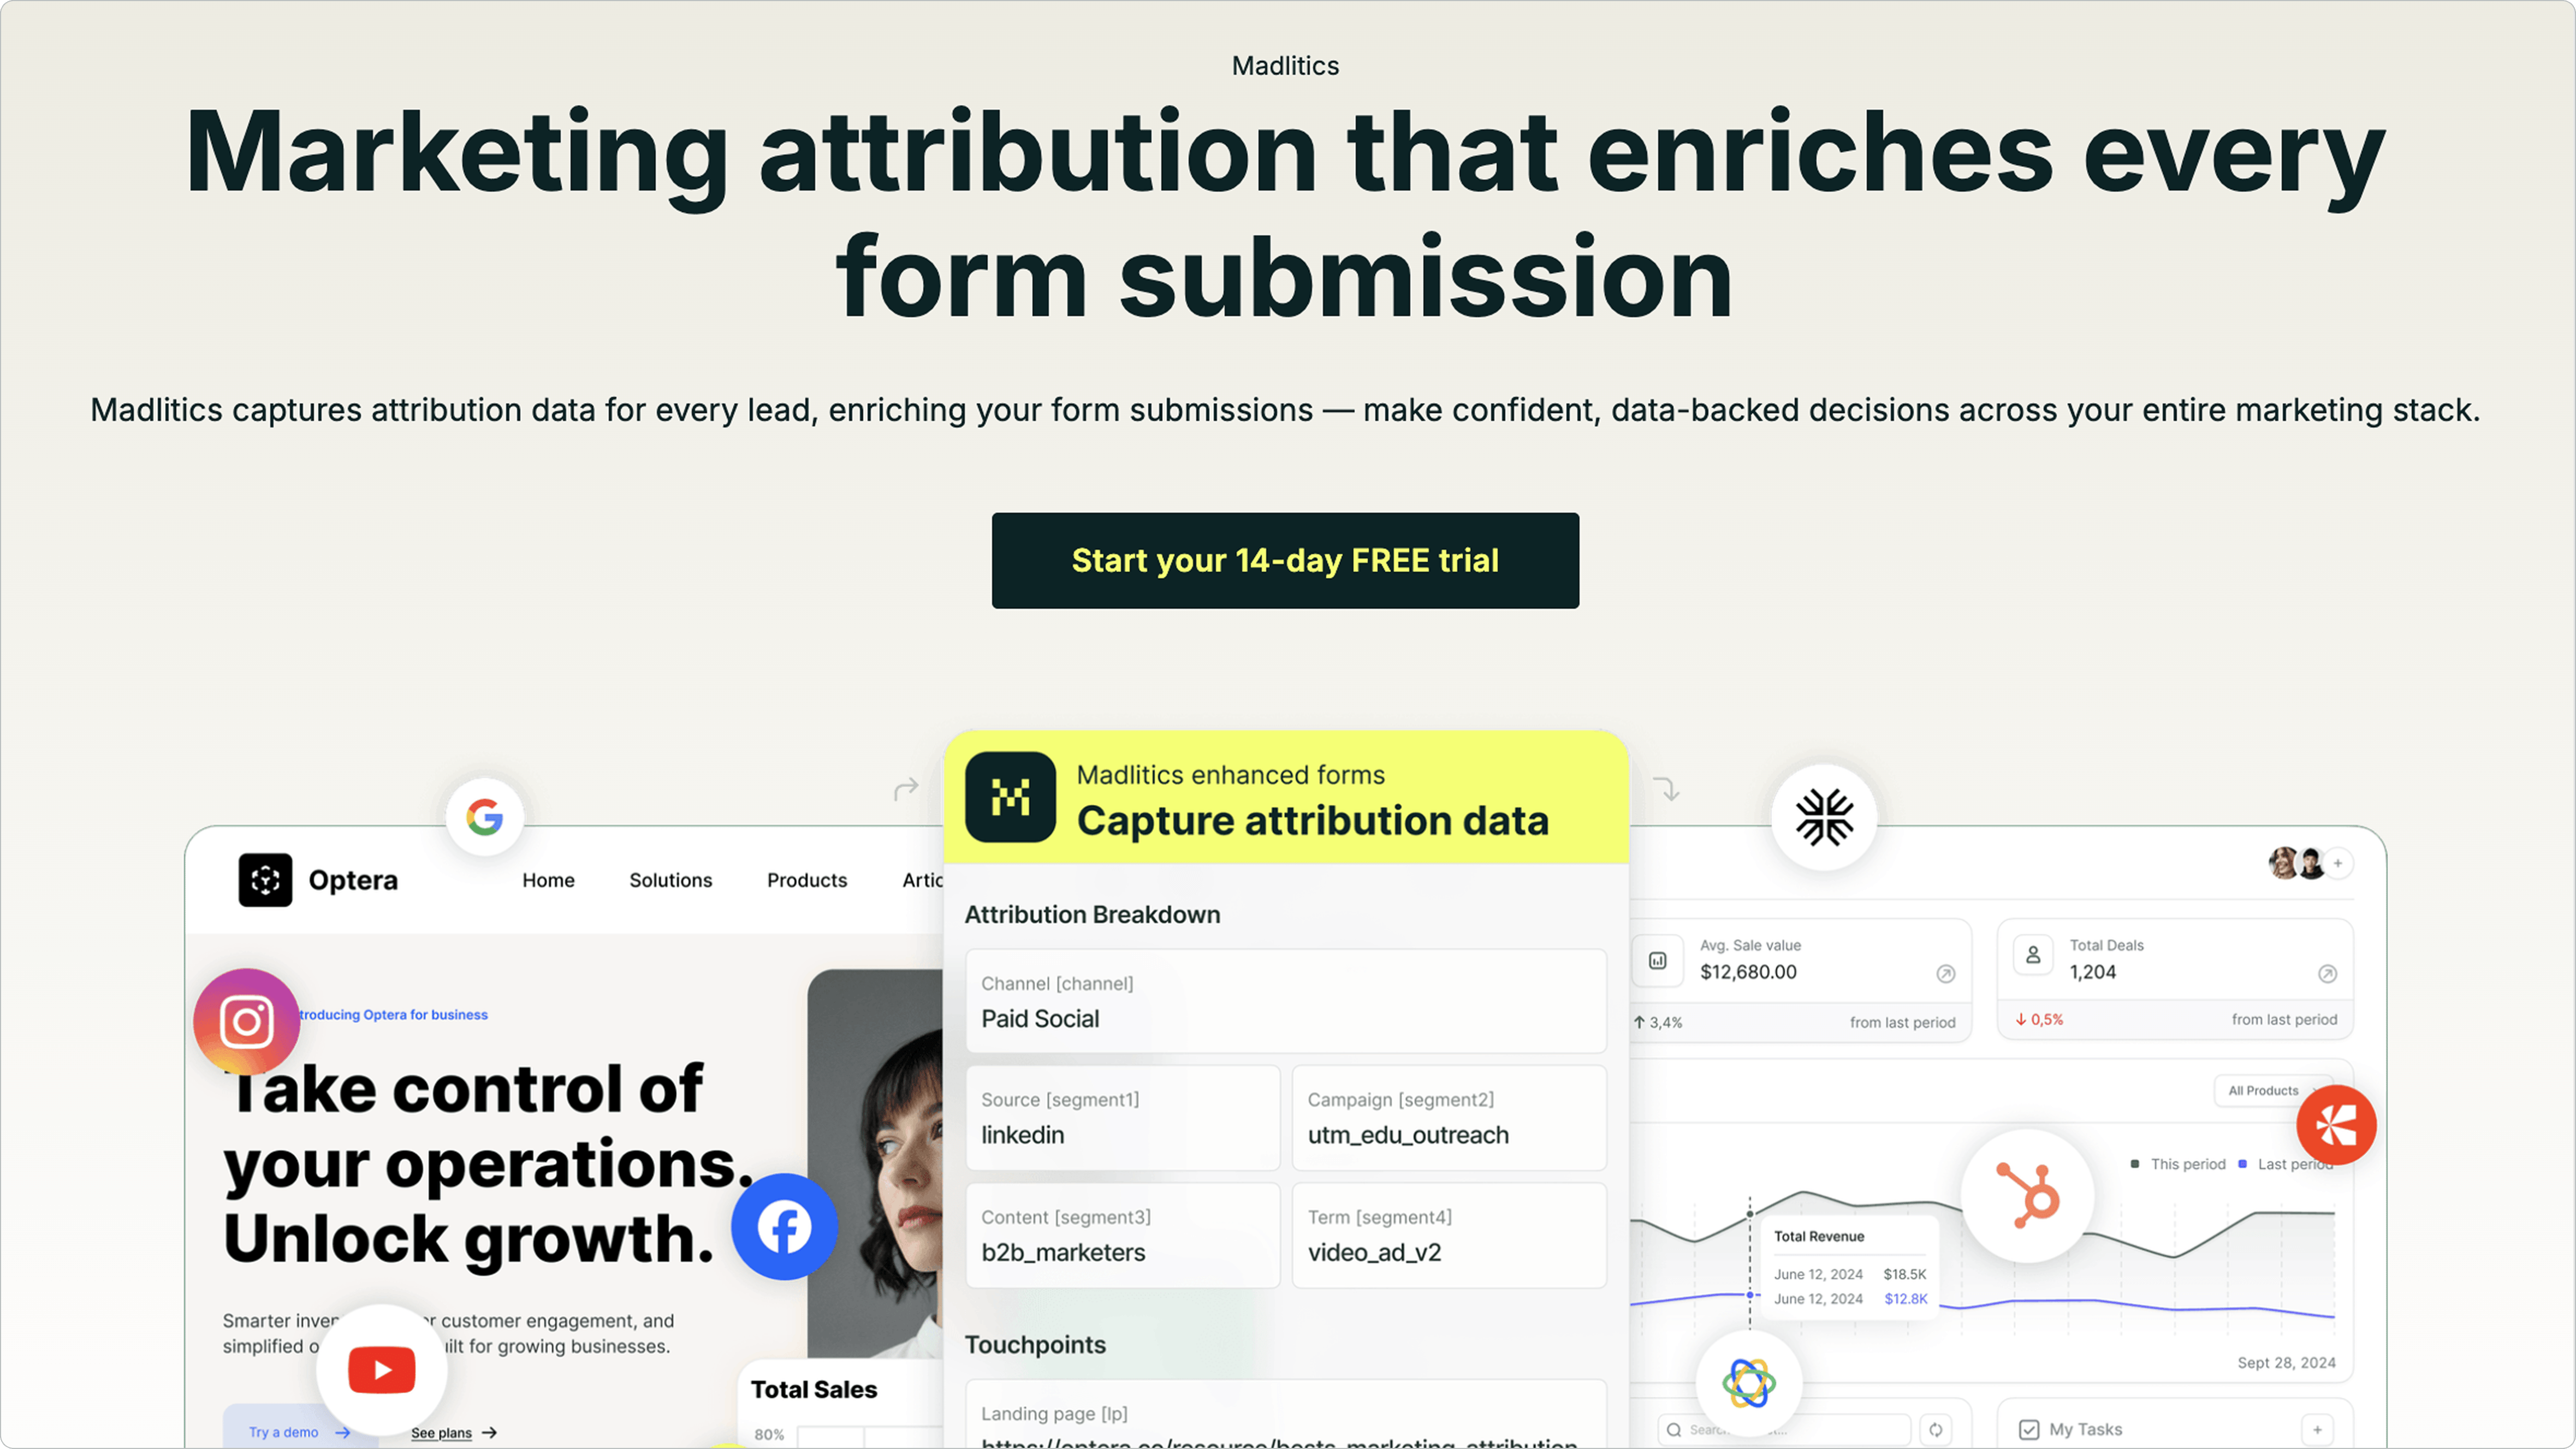
Madlitics steps in to solve these issues, offering tools that simplify KPI tracking. By enriching form submissions with detailed attribution data, it ensures you capture the full marketing context at the moment of conversion - and keeps that data consistent across your entire tech stack.
Complete Channel Coverage
Most attribution tools focus solely on paid campaigns, leaving major gaps in your data. Madlitics, on the other hand, tracks everything: organic search, social media, referrals, direct visits, and paid campaigns. This eliminates the frustrating "direct traffic mystery", where returning visitors are misclassified because session data gets lost.
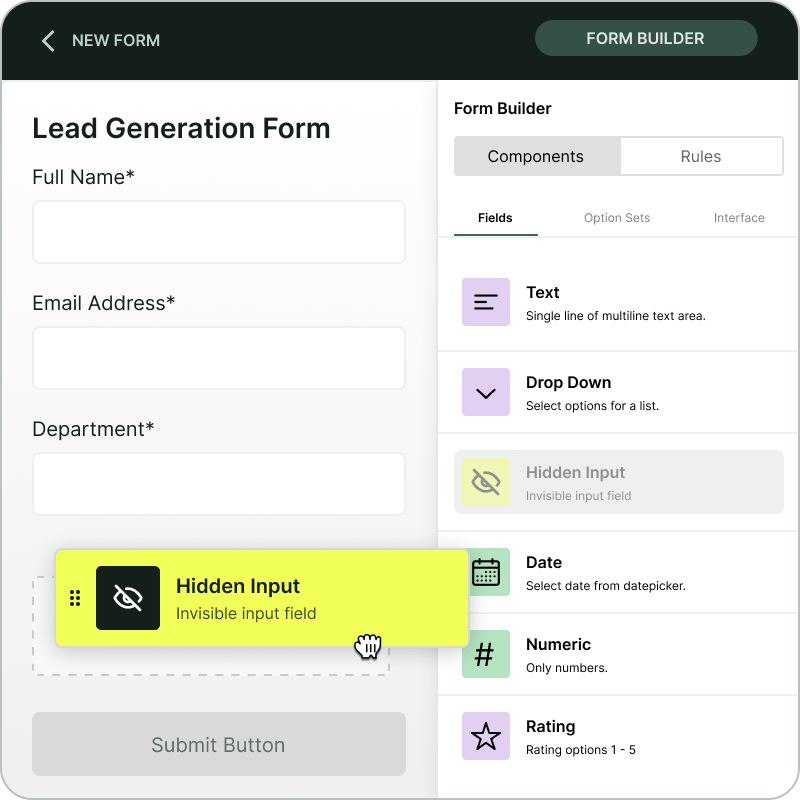
With a lightweight code snippet and invisible form fields, Madlitics automatically tags every lead with attribution details. It segments data into four levels - campaign source, platform, campaign name, and specific ad or creative type. This lets you answer key questions like, “Which LinkedIn ad brought in the most qualified leads?” or “Do organic social visitors convert better than paid ones?”
Sophie A., Head of Growth at a fintech company, shares: "We needed dependable channel categorization and UTM mapping without rewiring our stack. Madlitics delivered exactly that. It's now standard on every form we launch."
Persistent Attribution Across Sessions
Picture this: A prospect clicks on your LinkedIn ad, browses your site, leaves, and comes back three days later through a Google search to fill out a form. Without persistent tracking, that conversion would be credited to organic search, erasing LinkedIn’s role in the journey.
Madlitics solves this by maintaining source data across multiple sessions and page views, preserving the original attribution until the form is submitted. This feature is especially important for B2B companies, where 75% of customers take an average of four months to onboard. With browser privacy updates - like Safari cookies expiring after just one day - returning visitors often appear as new users. Madlitics uses first-party tracking to ensure attribution stays intact throughout the sales cycle.
As Madlitics puts it: "Whether someone returns after a day or a week, Madlitics preserves their original source all the way to form submission."
Auto-Cleaned and Normalized Data
Inconsistent UTM tags, duplicate campaign names, and broken tagging structures can wreak havoc on your KPI dashboards, leaving teams stuck cleaning spreadsheets at month-end. Madlitics automates this process, organizing and normalizing marketing data as it flows into your forms. It follows UTM best practices to fix parameters and standardize campaign labels (e.g., Paid Search, Organic Social, Referrals), saving you hours of manual cleanup.
By classifying raw visitor data into four levels - platform, campaign, ad group, and creative - Madlitics ensures that metrics like Conversion Rate by Channel and ROAS are accurate and consistent.
Tiffany M., a Campaign Manager at a non-profit, says: "Managing dozens of forms across different stacks, Madlitics keeps attribution consistent and client reporting is faster; we've cut hours of clean-up from month-end."
Sushil Goel from LayerFive adds: "In marketing specifically, unclean data manifests as inconsistent UTM parameters, missing source tracking, and duplicate customer records... providing false confidence in wrong decisions."
With clean, organized data, your KPIs reflect reality - not reporting errors.
Landing Page Insights
Madlitics doesn’t just track where visitors come from - it also tracks how landing pages contribute to conversions. By preserving landing page data for every form submission, the platform connects content performance directly to lead generation and revenue. Instead of relying on surface metrics like page views or bounce rates, you can pinpoint which pages and content paths drive the highest-quality conversions.
For example, you might find that visitors who land on a case study page convert at a much higher rate than those who start on your homepage. These insights can help you refine your content strategy, ensuring resources are allocated to what works best.
This data integrates directly with your CRM, giving your team a clear view of the customer journey from the first click to conversion.
CRM Integration
Attribution data is only useful if your team can act on it. That’s why Madlitics integrates with CRMs like Salesforce and HubSpot, pushing complete attribution details directly into lead records using your native integrations. Sales teams can instantly see which channel, campaign, or landing page brought in each prospect - no need for extra dashboards or custom reports.
Marco D., a Marketing Ops Manager in telecom, and Sam R., a Growth Lead at a tech startup, explain: "Madlitics keeps the attribution consistent everywhere and pushes the same fields into our CRM and email tool", making it easy for teams to use daily "because the data shows up where they already work. No training, no new dashboards."
By seamlessly connecting attribution data to your CRM, Madlitics closes the loop between marketing activities and revenue outcomes. This allows you to track metrics like Lead-to-Customer Rate and Customer Acquisition Cost (CAC) with full marketing context, enabling better forecasting and budget decisions.
Feature
Impact on KPI Reliability
Benefit to Marketing Teams
Complete Channel Coverage
Eliminates blind spots in lead generation reports
Tracks organic, social, referral, direct, and paid traffic
Persistent Attribution
Prevents "Direct" traffic inflation; accurate first-touch KPIs
Maintains source data across multiple sessions
Auto-Cleaned Data
Accurate ROAS and campaign-level ROI
Eliminates duplicate and fragmented campaign entries
Landing Page Insights
Connects content performance to pipeline contribution
Identifies which pages drive the highest-quality conversions
CRM Integration
Real-time reporting without manual data entry
Pushes clean attribution data directly into lead records
Getting marketing attribution right is a game-changer for translating data into revenue. Without it, you're essentially guessing which efforts are paying off and which ones are wasting your budget. Companies with flawed attribution setups often end up misallocating large chunks of their marketing spend.
Attribution connects the dots between your marketing efforts and actual business results. It helps pinpoint which campaigns, ads, or content pieces are driving real leads - not just clicks. This clarity often separates high-performing teams from those stuck pouring resources into channels that don’t deliver results.
By tracking the right KPIs with accurate attribution, you can spot top-performing channels, adjust strategies on the fly, and clearly show how marketing contributes to revenue. It’s the difference between seeing marketing as just another expense and recognizing it as a revenue driver.
How Madlitics Simplifies Attribution
Since accurate attribution is critical, having a tool that makes it easy is essential. That’s where Madlitics comes in. It simplifies attribution tracking by eliminating the need for multiple dashboards and manual data clean-ups. The platform captures traffic from all sources - organic search, social media, referrals, direct visits, and paid campaigns - ensuring no data slips through the cracks.
Madlitics also keeps attribution intact across multiple sessions. For instance, if someone clicks a LinkedIn ad, visits your site, leaves, and later returns through a Google search, the platform remembers the original source. This is especially useful for B2B marketers, where buying decisions often take time. Plus, it automatically cleans your data by normalizing UTM parameters and campaign names, so your dashboards reflect accurate metrics instead of messy errors.
Even better, Madlitics integrates directly with CRMs like Salesforce, HubSpot, and Zoho. This means your team can see exactly which channel, campaign, or landing page brought in each lead - without extra dashboards or manual data input.
Sam R., a Growth Lead at a tech startup, shares: "It's the first solution my team actually uses every day because the data shows up where they already work. No training, no new dashboards."
This seamless tracking ensures your team can act on reliable data immediately.
Get Started with Madlitics
If you’re ready to stop guessing and start understanding which channels bring in your best leads, Madlitics offers a 14-day free trial with no credit card required. Setup is quick - just add a code snippet and invisible form fields, and you’ll start collecting data right away. Soon, you’ll see which campaigns drive real growth, which channels convert, and where to focus your budget for the best ROI.
Designed for marketing teams that need accurate data without extra hassle, Madlitics helps you track ROAS, optimize CAC, and confidently show leadership how marketing impacts the bottom line. With its powerful attribution tools, you’ll make smarter, data-driven decisions across your entire marketing strategy.
Related articles to get you started with Madlitics
Accurate, persistent, and automated tracking — so your campaigns perform at their best.
Outperforms basic UTM tracking Madlitics captures, categorizes, and persists attribution data across sessions, giving you a complete, structured view of what’s working in your marketing. Say goodbye to losing attribution when users navigate your site, struggling with formatting inconsistencies, and ingored non-UTM traffic.
Capture all traffic Madlitics categorizes all inbound leads — whether they have UTM parameters or not — so every conversion is accounted for, and you won't miss out on Organic Search, Organic Social, and Referral traffic.
Attribution across pages and sessions A LinkedIn ad click should be attributed correctly—even if the visitor signs up on a different page later. If someone clicks an ad, browses multiple pages, then submits a form later, Madlitics persists attribution data across sessions, ensuring your reports reflect true performance.
Cleaner, more reliable data Duplicate UTMs and inconsistent formatting break reports and mislead teams. Madlitics cleans and organizes attribution data before sending it to your CRM, giving you accurate insights.
See which content converts Attribution isn’t just about where visitors came from—it’s about what convinced them to convert. By capturing landing page data alongside UTM parameters, Madlitics shows you which blog posts, case studies, or pricing pages drive the most revenue, helping you scale content that works.
Transform form submissions into actionable insights Madlitics connects marketing touchpoints to lead generation, ensuring every form submission is fully attributed — optimize ad spend by identifying high-ROI channels, refine messaging based on what content drives engagement, make data-driven decisions with clean, structured reports, and more.
Trusted by marketing teams everywhere
Built for real teams. Backed by real results.
Madlitics is trusted by marketers across industries to help reduce wasted spend and drive smarter growth.