Digital Marketing
Marketing Attribution Checklist: 12 Essential Steps
Marketing Attribution Checklist: 12 Essential Steps
Start capturing attribution →
Marketing attribution helps you figure out which marketing efforts drive conversions. With customer journeys becoming more complex - spanning multiple devices and touchpoints - understanding what works is critical. This 12-step checklist simplifies the process, covering everything from defining your funnel stages to automating data cleanup.
By following these steps, you can turn scattered data into actionable insights, improve marketing ROI by up to 30%, and create a single source of truth for your team.
To effectively track leads from their first interaction to conversion, you need clear, measurable funnel stages. These stages act as milestones, helping you monitor progress and assign credit across the entire customer journey - not just the first or last touchpoint.
Think of these stages as checkpoints marking meaningful transitions: First Touch (when someone discovers your brand), Lead Creation (when they provide contact information), MQL (Marketing Qualified Lead - showing genuine interest), SQL (Sales Qualified Lead - ready for a conversation), Opportunity (actively considering a purchase), and Converted Customer (when they officially sign on). Without these checkpoints, your attribution data will likely be fragmented and unreliable.
Here’s why this matters: 90% of users with multiple devices switch between them to complete a single task. Picture this - someone clicks a LinkedIn ad at work, reads your blog on their phone during lunch, and later requests a demo from their home laptop. If your funnel stages aren’t clearly defined and tracked, you risk losing visibility into this journey and failing to identify which interactions truly influenced their decision.
Different attribution models can help make sense of these complex journeys. For example, the W-Shaped Model focuses on three critical milestones: First Touch, Lead Creation, and Opportunity Creation. Meanwhile, the Full-Path Model distributes credit across four stages: First Touch, Lead Creation, Opportunity Creation, and Customer Close. However, these models depend on accurate CRM data and proper lifecycle tracking. If your sales team doesn’t consistently mark when a lead becomes an Opportunity, even the best models won’t yield accurate insights.
To get this right, audit your funnel, map each stage of the customer journey, and ensure your marketing and sales teams agree on the definitions. Update your CRM to reflect these stages so you can create a cohesive narrative for every prospect as they move toward conversion.
Once you've nailed down your funnel stages, it's time to focus on setting clear goals for your attribution strategy. Without specific objectives, all the data you gather can feel like noise - interesting, sure, but not actionable. To make attribution work, your goals need to focus on measurable outcomes tied directly to revenue, rather than vanity metrics like page views or social media impressions.
Ask yourself: Are you trying to optimize your budget, boost ROI, or gain a better understanding of your full funnel? For example, if your priority is maximizing ROI by validating campaign performance, that goal will shape the attribution model you choose and the KPIs you track. Clear goals are the foundation for choosing the right KPIs to guide your strategy.
The best goals link marketing performance to what matters most to executives. Gabriel Gervelis, a Fractional B2B Growth Marketing Executive, highlights this gap:
"Marketing success is communicated through vanity metrics like page views, MQL creation, or social media engagement and these metrics don't align with executives who focus on achieving revenue goals".
Instead of focusing on those surface-level metrics, align your KPIs with business-critical outcomes. Think marketing-influenced revenue, customer acquisition cost, and return on marketing investment. This alignment ensures that every step of your attribution strategy is tied to measurable results.
For different funnel stages, track specific metrics:
Timing matters, too. Match your lookback window to your sales cycle. For example, B2C companies with short cycles might stick to 7–30 days, while B2B companies with longer cycles should extend to 90–180 days. This ensures that top-of-funnel campaigns get the credit they deserve.
Keep your marketing ROI ratio between 5:1 and 10:1 - anything below 2:1 signals trouble. Use last year’s performance data to set realistic benchmarks for growth. Finally, test your model's accuracy by comparing attributed conversions with actual results. Aim for at least 85% path coverage (complete journey data for most conversions) and ensure your model's results align within 10–15% of actual outcomes.
Once your KPIs are set, the next step is to map out every interaction a customer has with your brand before they convert. These touchpoints span across various channels like paid ads, organic search, email, social media, and direct traffic. Without a clear map, it’s tough to pinpoint which channels are truly driving conversions and which just happen to be part of the final steps.
To start, use JavaScript tracking to log page views and user actions. Pair this with UTM parameters to tag each campaign with its source, medium, and creative details. This creates a clear trail of data, making it easier to analyze later. By mapping these touchpoints, you lay the groundwork for choosing the right attribution model in the following steps.
But don’t limit your focus to digital interactions. Customer journeys today often blend online and offline experiences, such as sales calls, trade shows, or in-store visits. To capture these, integrate your CRM to track physical touchpoints alongside digital ones. This comprehensive approach ensures you’re not missing key interactions.
Given that most people switch devices and engage with your brand multiple times before purchasing, accurately tracking these interactions is crucial. Tools like Google Analytics 4 can help. Its conversion path reports detail the sequence of channels leading to a sale. For more advanced insights, Markov chain visualizations can show touchpoints as connected "nodes", revealing which interactions have the most influence on conversions. These tools emphasize the importance of consolidating data from all channels.
As you map out interactions, categorize touchpoints by their role in the funnel. For example:
Additionally, identify key pages in the journey:
Organizing touchpoints this way helps you see not only how channels perform but also which content drives action.
Finally, centralize all your data for a complete view of the customer journey. Remember, native reports often overstate their own impact while ignoring how other channels assist conversions. To avoid this, consider using a centralized data warehouse like Snowflake and visualization tools like Looker. These solutions provide a unified view of your data, making it easier to move forward with your attribution strategy.

Once you’ve mapped your touchpoints, the next step is ensuring you can track which campaigns are driving those interactions. This is where UTM parameters (Urchin Tracking Module) come into play. These short text codes, added to the end of URLs, allow you to pinpoint exactly where your traffic originates - whether it’s from emails, social media posts, or ads. Without them, you’re left guessing instead of knowing which efforts lead to conversions.
UTMs act like digital tags that follow your visitors through analytics. For example, when someone clicks on a link tagged with ?utm_source=facebook&utm_medium=paid-social&utm_campaign=spring-sale-2026, your analytics platform records all those details. This is crucial because many companies neglect UTM markup in over 30% of their campaigns, making it harder to attribute revenue accurately. Traffic without UTMs often gets lumped into the “Direct” category, leaving 25–30% of your data unclear and less actionable.
To get started, focus on using the five standard UTM parameters consistently. Here’s a quick breakdown:
A few best practices can help you maximize the effectiveness of UTM tracking:
utm_medium values, such as cpc, email, social, or paid-social. This keeps your traffic categorized correctly and prevents it from being labeled as "Unassigned".
Once you’ve set up UTM tracking, the next step is choosing the right multi-touch attribution model. This decision determines how credit is distributed across your marketing touchpoints, directly influencing how you allocate budgets and make strategic choices.
Some of the most widely used attribution models include Linear, Time Decay, and Position-Based (U-Shaped):
The best model for your business depends on your sales cycle and marketing objectives. For instance, B2B companies with longer, more complex sales processes might benefit from Time Decay or W-Shaped models, which account for key milestones like lead creation. On the other hand, B2C brands with shorter purchase cycles may find Linear or Position-Based models more suitable. It’s also crucial to choose a model that can handle cross-device journeys, as consumers often switch between devices while making decisions. In fact, the average buyer interacts with about eight touchpoints before converting, and 90% of device owners switch screens during tasks.
Tools like Madlitics simplify this process by offering persistent multi-touch tracking. Their platform ensures data continuity across multiple visits, even if conversions happen weeks later. This prevents overlap where multiple platforms might claim full credit for a single sale. Madlitics also tracks data across four levels - channel, platform, campaign, and creative - and integrates directly into your CRM, eliminating the need for manual data cleanup. For B2B teams managing deal sizes between $5,000 and $500,000, this level of precision is critical, as poor budget allocation can waste 25%–40% of marketing spend.
If you’re just starting out with multi-touch attribution, consider beginning with a Linear model to establish a baseline. Once you’re comfortable, you can experiment with more advanced models that better align with your funnel’s complexity. The ultimate goal is to select a model that works seamlessly with your tracking setup - especially if you’re using Madlitics - to ensure accurate attribution throughout the entire customer journey. This step sets the stage for fully automating your attribution process in future phases.
Once you've selected your multi-touch attribution model, the next step is integrating tools that ensure you capture data from every traffic source. This comprehensive tracking is essential for eliminating blind spots and achieving accurate attribution across channels, whether it's organic search, social media, referrals, or direct visits.
Madlitics simplifies this process by automatically tracking all visitor traffic - not just paid campaigns. When connected to your forms, it attaches precise channel, campaign, and landing page data to every submission. This tackles a common challenge, as only 53% of marketers are confident in their ability to measure ROI across all channels. Madlitics integrates with popular form builders like Elementor, Gravity Forms, WPForms, and Webflow Forms, ensuring that crucial attribution data flows directly into your CRM - no manual spreadsheets or cleanup required.
To go beyond basic tracking, server-side tagging through tools like Google Tag Manager Server-side is a game-changer. This method addresses signal loss caused by ad blockers and browser restrictions. For example, Safari's Intelligent Tracking Prevention (ITP) limits cookie lifespans to just one day, which can cause traditional analytics to misclassify returning visitors as new ones. Server-side tracking ensures your data remains intact, even when browser-based methods fall short. When paired with advanced identity resolution techniques, this approach keeps your data unified across all customer interactions.
Identity resolution engines take this a step further. By using both deterministic signals (like email addresses or user IDs) and probabilistic data (such as behavioral patterns), these tools can connect touchpoints across devices and sessions with up to 95% accuracy. This capability is essential for reconstructing customer journeys, especially in scenarios with long sales cycles.
For businesses with extended sales cycles, multi-session tracking is critical to preserving the original source data. Imagine a prospect discovers your brand through organic search on Monday but doesn’t convert until Friday after multiple visits. Without proper tracking, you might miss the importance of that first touchpoint.
Madlitics ensures attribution data remains intact across sessions, making it invaluable for B2B marketers. On average, B2B buyers engage with about eight touchpoints before converting. Without persistent tracking, you risk incorrectly attributing the conversion to the final direct visit rather than the initial organic search that sparked interest. This can lead to poor budget allocation and misguided marketing strategies.
The platform organizes visitor journeys into top-level marketing channels, with detailed segmentation by platform, campaign, and creative asset. This four-layer tracking system integrates seamlessly with your CRM, giving sales teams a clear view of where each lead originated. Extending the attribution lookback window to match your sales cycle - often 180 days or more for B2B - makes this feature even more critical.
Tracking the specific landing page for every lead submission turns vague metrics into actionable insights. Instead of relying on surface-level data like page views, you can directly link conversions to the pages and paths that generated them.
Madlitics automatically captures landing page data, helping you pinpoint which content assets drive the most conversions. This allows you to focus your efforts on high-performing pages, whether they’re blog posts, product pages, or resource downloads. For instance, if your pricing comparison page generates twice as many qualified leads as your homepage, that insight can inform your paid ad strategy and internal linking decisions. By identifying what works, you can allocate your budget and resources where they’ll have the greatest impact.
Poor-quality data is more than just an inconvenience - it’s a costly problem. On average, it drains $12.9 million annually from organizations through wasted resources and missed opportunities. Issues like inconsistent data, duplicate entries, and fragmented classifications can make attribution reports unreliable and frustratingly inaccurate.
Madlitics addresses this head-on by automating the organization and normalization of marketing data as it’s collected. For instance, when a visitor submits a form, the platform ensures that channel, campaign, and landing page data are already clean and standardized. This eliminates the need for manual cleanup, fixes broken UTM parameters, and reduces the common problem of "unknown" or "direct" traffic buckets that often plague attribution systems.
The payoff for clean, normalized data is massive. Studies show it can drive up to 23% higher revenue growth. One example highlights a team that swapped manual data standardization for automated normalization, saving them nearly 90 hours per week. That freed up their time to focus on meaningful analysis instead of repetitive formatting tasks.
Automation doesn’t just save time - it also ensures consistency. It standardizes metrics across platforms by aligning currencies, time zones, and date formats (such as converting everything to MM/DD/YYYY for U.S.-based teams). This creates a reliable single source of truth, which is especially important when machine learning models come into play. Clean data can improve prediction accuracy by 15% to 30%.
With your data now cleaned and consistently formatted, you’re ready to move on to enhancing lead data integration in the next step.
After cleaning and organizing your attribution data, the next logical move is to feed this information directly into your CRM. Why? It transforms basic form submissions into detailed lead records, giving your sales team the context they need to act effectively.
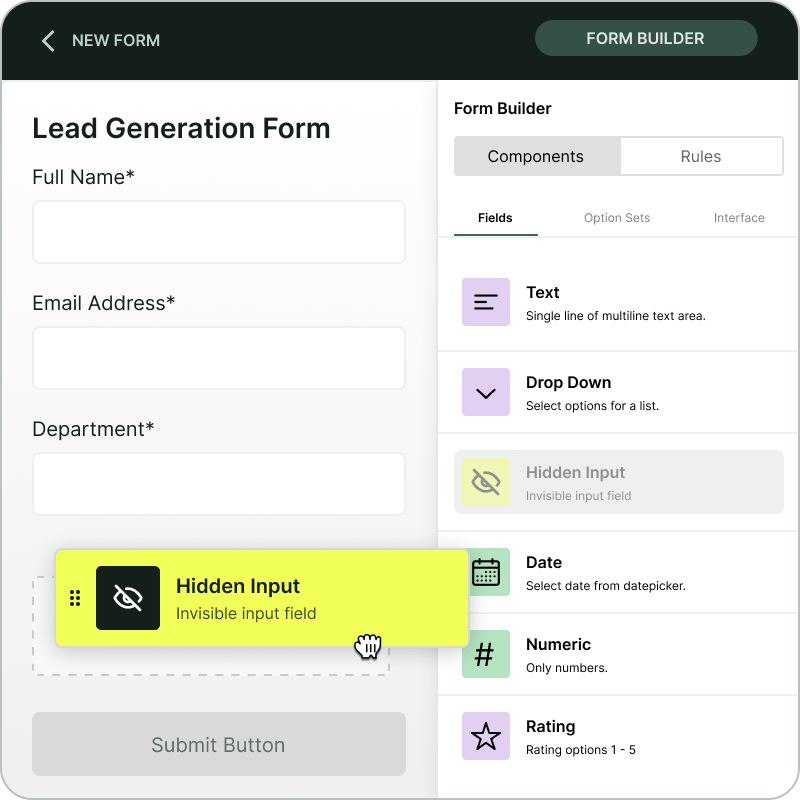
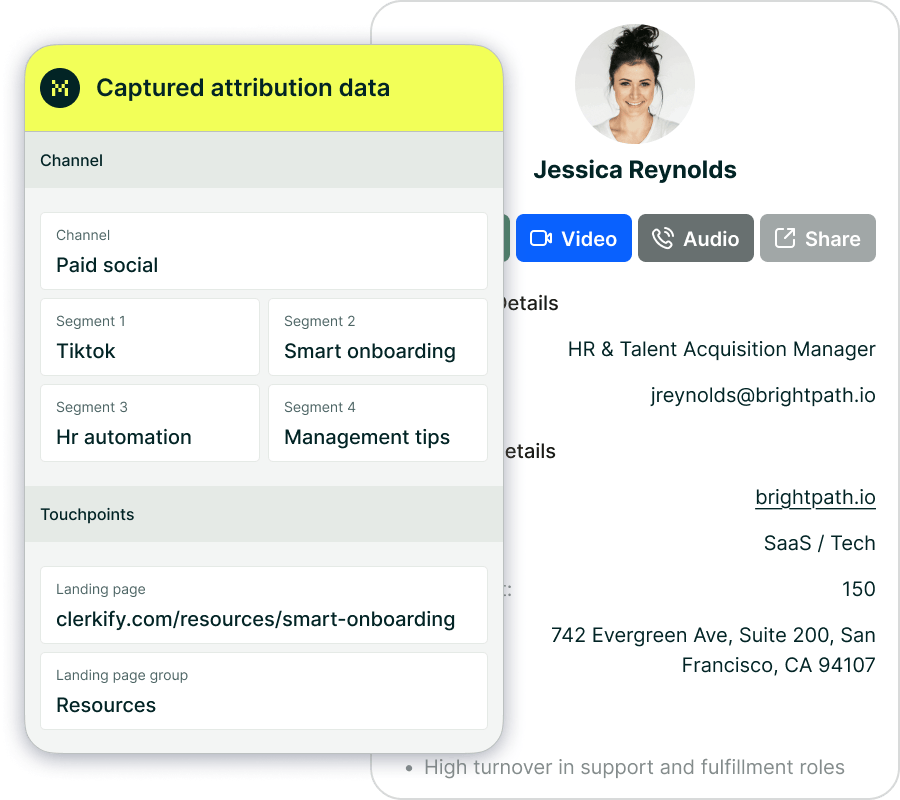
Madlitics simplifies this process by capturing key data points - like first-touch sources, UTM parameters, and campaign details - and funneling them into your CRM through hidden form fields. When a prospect fills out a form, your CRM instantly gets enriched data such as the ad they clicked, the content they viewed, and the landing page they came from. This allows sales reps to focus on high-intent leads and adjust their outreach based on the prospect’s journey - whether they attended a webinar, downloaded a whitepaper, or clicked on a targeted ad.
This seamless integration bridges the gap between sales and marketing, creating a unified view of which campaigns are driving actual revenue instead of just generating leads. By improving lead quality, it also helps optimize marketing budgets. Without clear performance insights, companies end up wasting between 40% and 60% of their digital ad budgets. Proper attribution, however, can reduce wasted spend by as much as 94%.
To make this work, add seven hidden fields to your lead capture forms - such as channel, segment1, segment2, segment3, segment4, lp, and lpg - and map these to custom properties in your CRM. Don’t forget to include offline interactions like phone calls. For example, Four15 discovered that 57% of their SEM leads came from previously untracked phone calls.
"We run dozens of forms across platforms. Madlitics keeps the attribution consistent everywhere and pushes the same fields into our CRM and email tool." — Marco D., Marketing Ops Manager, @Telecom
Once you've enriched your lead data in your CRM, the next step is to validate your attribution accuracy through detailed testing. Reliable attribution data is critical for making informed decisions about campaign budgets. If the data isn't accurate, you could end up wasting money on channels that appear effective in reports but fail to generate real revenue.
One effective method to test attribution accuracy is geo-split testing. This involves comparing performance across different regions - such as states, DMAs, or ZIP codes - to measure the actual incremental lift from your marketing efforts. For example, a mid-market SaaS company conducted geo-holdout tests alongside their quarterly attribution model. They discovered that paid social had been over-credited by 18%. By reallocating budget to video and content syndication based on verified incrementality, they achieved a 12% improvement in pipeline per dollar within a single quarter.
Another essential step is to reconcile attributed revenue with your CRM pipeline and Finance records. Ideally, the variance between attributed opportunities and CRM totals should be less than 5%. A B2B tech company, for instance, audited its identity resolution processes and refined its UTM tagging standards and form tracking. This reduced the variance between marketing attribution and Finance reporting to under 3%. With this confidence, the company shifted budgets, leading to a 19% increase in opportunity volume from high-performing channels over two quarters.
You should also run sensitivity checks by tweaking lookback windows. If credit distribution shifts by more than 10%, it's a sign to review your data or tagging. Additionally, aim for an identity match rate of at least 90% and touchpoint coverage of at least 85%. These benchmarks ensure your model can accurately map customer journeys across devices and sessions, which is vital for maintaining attribution accuracy.
To keep your data reliable over time, establish a validation routine. This might include weekly automated tracking checks, monthly reviews with Sales and Finance teams, and quarterly deep audits where you refine models and explore new testing methods. Be sure to document every change to lookback windows, weighting rules, or channel definitions in a change log. This allows you to track how adjustments impact accuracy metrics over time, ensuring your data remains dependable.
Once you've validated your attribution data, it's time to put those insights to work. Start by focusing on the metrics that directly affect your bottom line - Return on Investment (ROI), Return on Ad Spend (ROAS), and Customer Acquisition Cost (CAC). These numbers reveal which channels are driving profits and which are eating into your budget. Considering that 63% of marketing leaders are under increased pressure from CFOs to prove campaign effectiveness - and with companies wasting an estimated 40–60% of their digital marketing budgets on ineffective strategies - this step is critical. By analyzing these metrics, you can pinpoint which channels fuel growth and which ones need rethinking.
Don’t get stuck on last-click conversions alone. Combine these metrics with the touchpoint data you've gathered to get a full picture of how each channel performs. For example, LinkedIn might not show strong last-click results, but if it appears in 60% of your high-value customer journeys, it’s clearly playing an important "assist" role. Ignoring this could lead to underfunding a channel that helps close deals. One SaaS team, for instance, shifted 16% of their budget from underperforming retargeting campaigns to high-intent channels, which resulted in a 31% boost in ROMI and shortened their payback period by 2.5 months.
"Marketing attribution aims to redirect the flow of wasted dollars from ineffective channels to the most effective channels and tactics." – David Broderick, Martech.org
When reallocating budgets, focus on marginal returns rather than total revenue. Rank your channels based on the incremental lift they provide per dollar spent, and adjust your spending accordingly. Use your attribution platform to simulate these budget changes before making them live. This allows you to predict how shifting funds will impact incremental ROAS (iROAS) across different customer segments without putting your budget at unnecessary risk. Also, keep an eye on saturation points - those moments when additional spending no longer delivers proportional results - and redirect funds to channels that still have scaling potential.
To stay on top of your campaigns, establish a regular optimization routine. Review weekly reports to make small, tactical adjustments. Conduct monthly meetings with your Sales and Finance teams to reconcile results, and schedule quarterly deep dives to refine your attribution models and test new channels. Document every budget change and track the outcomes in a shared dashboard. This not only ensures accountability but also helps you learn which strategies actually move the needle for your business.
Marketing attribution models aren’t a one-and-done deal - they need consistent updates to stay accurate. Why? Because customer behavior changes over time, new marketing channels pop up, and privacy regulations like GDPR and CCPA keep evolving. According to the Adobe Experience Cloud Team, you should review your marketing attribution model at least quarterly and make adjustments as needed. Failing to do so could mean you’re making budget decisions based on outdated assumptions that no longer reflect how customers interact with your brand.
So, how do you know it’s time for a tune-up? Here are some key signals to watch for:
With browsers phasing out third-party cookies and stricter regulations limiting traditional tracking, server-side tracking solutions are becoming more important than ever. Plus, with about 90% of users switching between multiple devices to complete tasks, ignoring cross-device journeys could mean losing valuable insights into conversions.
To refine your model, try running the current version alongside a new one for 90 days to compare performance. Use cohort-level incremental ROAS (iROAS) as your key metric - it ties attribution changes directly to revenue growth. Set aside 10–20% of your audience as a holdout group to measure the incremental impact of your adjustments.
Finally, keep everything documented. Maintain a versioned audit trail that logs key details like run dates, model parameters, lookback windows, and data completeness checks. Having a dedicated team to oversee attribution modeling ensures unbiased reporting and helps prevent skewed budget allocations.
Clear documentation is essential to avoid confusion and ensure consistent reporting. Without it, team members might struggle to understand how the system operates, leading to errors and misinterpretations.
Start by outlining your attribution methodology and the model you’ve chosen. Whether you’re using Linear, U-shaped, W-shaped, or Data-Driven models, specify your selection and explain the reasoning behind it. This step can help preempt any doubts about the model’s validity when results don’t align with expectations. As Anahid Basmaijan from AdRoll emphasizes:
"Having a clear set of goals from the outset will help you decide which attribution model(s) to use, what data to include, and what technology is most appropriate".
Your documentation should also include a data dictionary. Define key terms such as "conversion", "lead", and "opportunity" to ensure everyone - whether in Marketing, Sales, or Finance - has a shared understanding. Additionally, establish consistent lookback windows for each channel. For instance, you might use a 7-day click/1-day view window for social media and a 30-day click window for search. Keep these settings stable during validation to maintain accuracy. To further organize your process, create a model run manifest. This should log details like the run date, date range, model type, specific parameters, and a link to the change log. This level of detail ensures your attribution results are both reproducible and auditable.
Don’t stop at the methodology - document your data infrastructure and identity resolution process as well. Include details about data ingestion methods (e.g., APIs or server-side tagging), how users are tracked across devices, and steps taken to clean and transform raw data. Jamie Isabel from MetricMaven highlights the importance of precision in this area:
"If identities don't resolve cleanly, timestamps don't align, channels aren't normalized, or events aren't consistent, you're not running attribution, you're running assumptions at scale".
Finally, schedule regular reviews to keep your documentation and processes up to date. Review data standards monthly, revenue taxonomy quarterly, and model design semi-annually. This routine ensures your system evolves alongside changes in channels and customer behavior, preventing it from becoming outdated.


The 12-step checklist you’ve worked through offers a solid foundation for reliable marketing attribution. Crafting an attribution strategy isn’t about achieving perfection - it’s about ensuring consistency and connecting all the dots. By following these steps, you create a system that ties every interaction to actual conversions, allowing you to pinpoint which channels are driving results rather than relying on scattered or incomplete data. As Mark Hayes from Shopify puts it, "performance should inform business decisions, and KPIs should drive actions".
The stakes couldn’t be higher: studies reveal that over 40% of digital ad spend goes to waste due to poor planning and gaps in data insights. On the other hand, businesses that adopt structured attribution strategies can boost ROI by up to 30% by redirecting budgets to the most effective channels - a shift that depends on whether decisions are based on clean, centralized data or guesswork. These numbers highlight why a disciplined approach is essential at every stage of your marketing efforts.
Attribution isn’t just a reporting tool; it’s a framework for strategic decision-making that unites marketing, sales, and finance under a single, reliable source of truth. Take Blue Apron’s example: by analyzing their attribution data, they found that 34% of their new customers came from referrals. This insight allowed them to focus on referrals as a key growth channel.
To keep your attribution efforts on track, use UTM parameters in your forms, sync your CRM, and perform regular data audits. As your capabilities grow, consider adopting advanced multi-touch models and automated tools for optimization. Remember, consistency in applying an attribution model is far more important than striving for absolute precision.
Answers to your top questions