Digital Marekting
How to Calculate Marketing ROI: Step-by-Step Guide
How to Calculate Marketing ROI: Step-by-Step Guide
Start capturing attribution →
(Revenue – Marketing Cost) / Marketing Cost × 100
For example, if you spend $10,000 on a campaign and it generates $50,000 in revenue, your ROI is 400% - meaning you earn $4 for every $1 spent.
Why It Matters:
Steps to Calculate Marketing ROI:
Accurate tracking tools like Madlitics can simplify attribution and provide insights into which channels and campaigns drive results. By consistently measuring ROI, you can eliminate wasteful spending and turn marketing into a revenue driver.

To measure ROI accurately, you need a clear picture of all marketing expenses - both the obvious ones and the ones that might not be so apparent. Properly tracking these costs ensures you're not overlooking anything that could skew your results.
Direct costs are the easiest to spot. These are the expenses tied directly to specific campaigns or activities. For example:
If you spent $5,000 on a PPC campaign or hired a videographer for $2,500, those are direct costs. These types of expenses are typically well-documented in invoices or dashboards, making them straightforward to track
Indirect costs are trickier and often overlooked. These include things like software subscriptions (e.g., Madlitics), team salaries, training programs, and even a share of office overhead.
For labor costs, you can calculate an employee's hourly rate by dividing their annual salary by 2,080 hours (the standard number of work hours in a year). Multiply that hourly rate by the time they spend on a campaign. For instance, if a marketing manager with a $75,000 salary spends 20 hours on a project, their contribution costs about $721 ($75,000 ÷ 2,080 ≈ $36.06/hour × 20 hours).
"You need to know how much you spend in marketing (how much to create content, how much spent in advertising, how much for your marketing reporting software, how much for your marketing staff, etc.) and how many sales you make thanks to these campaigns." - Jonathan Aufray, Growth-Hackers
Ignoring these hidden costs can give you a false sense of success. A campaign might look profitable at first glance, but once you factor in software fees, salaries, and overhead, it could actually be losing money. This might explain why only 37% of CMOs feel confident in proving short-term ROI, and that number drops to just 31% for long-term ROI.
Understanding why marketing attribution matters is essential for this next phase. Once you've nailed down all your costs, you're ready to move on to Step 2: tracking and attributing revenue.

Once you've tracked costs, the next step is figuring out which campaigns are actually driving revenue. This involves assigning a financial value to every marketing and sales interaction.
Top-performing marketing teams get this right about 85–95% of the time, while others struggle with accuracy rates as low as 30–40%. Poor attribution systems can lead to 25–40% of marketing budgets being misallocated.
Attribution models are frameworks used to credit sales across various touchpoints in a customer journey. Single-touch models are straightforward but limited. For instance:
For a broader perspective, multi-touch models come into play:
Choosing the wrong model can skew your results. For example, overemphasizing final interactions can lead to undervaluing early awareness campaigns, which might hurt your overall strategy. Selecting the right model ensures a balanced view and lays the groundwork for using advanced attribution tools.
To get attribution right, your data needs to be clean, and your systems - like CRM, automation, and analytics - must be unified into a single, reliable source. Yet, many tools fall short. They often lack transparency around costs or fail to track users across multiple sessions and devices.
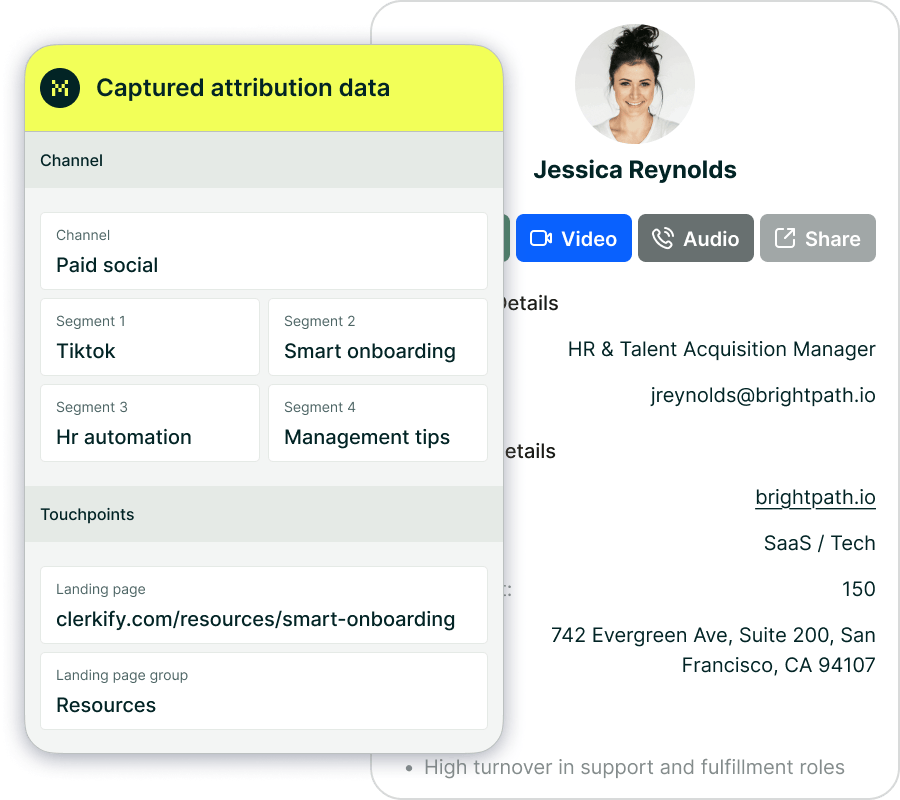
This is where platforms like Madlitics shine. It offers complete coverage, tracking not only paid campaigns but also organic search, social media, referrals, and direct traffic. Its persistent attribution ensures that the original lead source is retained even when users return through different sessions before converting. This solves a common problem where leads are mistakenly categorized as "direct" traffic, which can obscure the true source of conversions. Furthermore, it keeps detailed records of landing pages for every submission, so you can tie conversions back to the specific pages and content that drove them.
The result? Businesses that adopt automated marketing attribution typically see a 20–30% boost in ad spend efficiency. With accurate attribution in place, you're ready to calculate your true Marketing ROI.
Once you've nailed down your costs and revenue, it's time to calculate your return on investment (ROI). The formula is simple:
(Revenue – Marketing Cost) / Marketing Cost × 100
For example, if you spend $10,000 on marketing and it generates $50,000 in revenue, your ROI is 400% - a 5:1 ratio.
But here's the catch: this basic formula assumes that every dollar of revenue growth stems from your marketing efforts, which isn’t usually the case. To get a clearer picture, you need to account for organic growth - sales that would’ve happened without your campaign. That’s where the attributable ROI formula comes in:
(Sales Growth – Organic Sales Growth – Marketing Cost) / Marketing Cost × 100
If your business naturally grows by a certain amount each quarter, you should subtract that baseline organic growth before calculating ROI. This adjustment ensures your campaign isn’t credited for revenue it didn’t actually drive.
Let’s break it down with an example. Say you run a paid search campaign with a total spend of $15,000. By the end of the quarter, it generates $75,000 in revenue. Using the basic formula:
($75,000 - $15,000) / $15,000 × 100 = 400%
That’s a 5:1 ratio - a solid result by most industry standards.
Now, if your historical data shows that your business typically grows by $10,000 per quarter without marketing, you’d adjust the calculation:
($75,000 - $10,000 - $15,000) / $15,000 × 100 ≈ 333%
This adjusted ROI gives you a more realistic measure of your campaign’s performance. As a general rule, an ROI below 2:1 is usually unprofitable once overhead and production costs are factored in, while a 10:1 ratio is considered excellent.
ROI is a powerful metric, but it doesn’t tell the whole story. To gain deeper insights, you should also track metrics like Cost Per Lead (CPL), Customer Acquisition Cost (CAC), and Customer Lifetime Value (CLV):
For businesses with longer sales cycles - especially in B2B - pipeline influence is another critical metric. It measures how marketing impacts each stage of the sales funnel, highlighting the value of early-stage content and nurture campaigns. Tools like Madlitics can help you pinpoint this influence with accurate attribution.
Calculating ROI is just the beginning; the real impact comes from using that data to make smarter decisions. Top-performing teams achieve this by maintaining precise attribution and consistently refining their strategies through disciplined measurement and adjustments. The next step is to break down each channel’s performance and reallocate resources to maximize results.
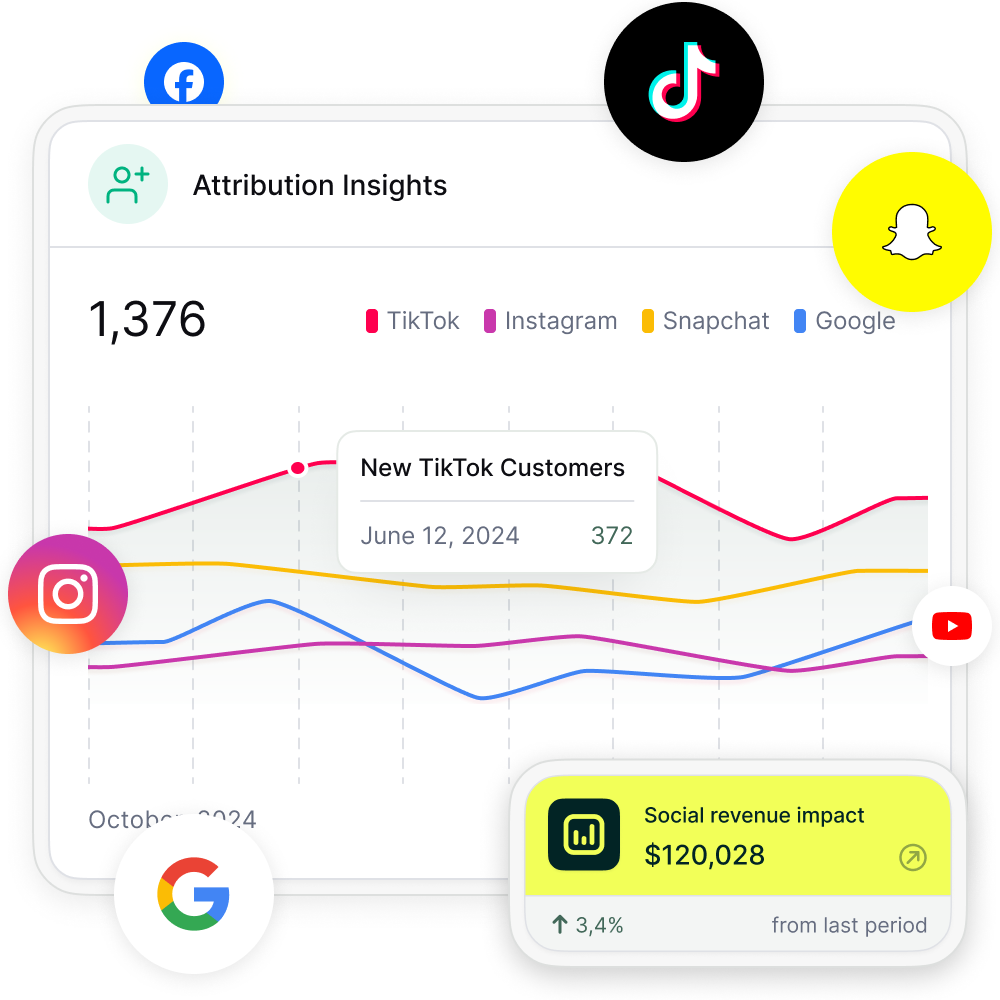
ROI calculations reveal which channels truly drive revenue - not just traffic. Relying solely on last-click attribution can lead to overlooking the contributions of top- and mid-funnel activities. To get a clearer picture, you need a more detailed approach to channel tracking.
Platforms like Madlitics allow for deep segmentation, analyzing performance from the campaign source level all the way down to specific ad variations and messaging. For instance, if your dashboard shows that 40% of leads come from "direct" traffic, it’s likely hiding the actual impact of channels like LinkedIn or email. Detailed lead source attribution can uncover the real drivers behind those conversions.
Once you’ve identified which channels deliver the best ROI, apply the 70/20/10 rule: allocate 70% of your budget to top-performing channels, 20% to testing, and 10% to experimenting with new ideas. Reassess and adjust these allocations monthly based on fresh ROI data. If a channel starts contributing more revenue than its current budget share, shift resources accordingly. Without proper attribution, companies often misallocate 25–40% of their marketing budgets, so regular recalibration can help recover significant wasted spend.
After identifying your strongest channels, focus on improving campaigns by analyzing the data and refining your creative strategies. Start with data hygiene - clean up duplicate UTM parameters and fix manual tagging issues in forms that can distort reports and lead to bad decisions. Use tracking URLs with UTM parameters consistently for blog posts, social media, and emails to pinpoint which content drives visitors to your landing pages.
For underperforming campaigns, dive deeper with multi-level segmentation to find the root cause. Is the issue with the audience, the offer, or the creative? Tools like Madlitics let you analyze performance across campaign sources, offers, and specific ad variations, enabling you to isolate weak points and make targeted improvements. Test at least 10 variations of ad copy and creative simultaneously - top-performing creatives often change with the seasons - and let tests run for at least two weeks to account for weekly fluctuations.
It’s estimated that marketing teams waste up to 30% of their budgets on untracked channels. Tools like Madlitics solve this by integrating with your CRM to connect marketing touchpoints to closed-deal revenue. This ensures that the original lead source is credited, even if the conversion happens weeks later across multiple visits or pages. With this level of insight, you can confidently shift budgets from low-performing campaigns to high-performing ones without increasing overall spend. By turning marketing into a predictable driver of growth, systematic ROI analysis and optimization can transform your efforts into a reliable engine for revenue growth.


Calculating marketing ROI lays the groundwork for transforming marketing efforts from a cost into a revenue-driving powerhouse. The four-step process outlined here - gathering all costs, tracking attributed revenue, calculating ROI within context, and improving performance systematically - provides a clear path to demonstrate marketing's value while enabling smarter budget decisions. This approach helps you allocate resources efficiently and improve campaign outcomes.
The importance of this cannot be overstated. Poor attribution systems can lead to wasted marketing budgets, while businesses that measure their ROI are 12 times more likely to achieve higher returns compared to those that don't. By pinpointing which channels generate revenue - not just traffic - you can confidently redirect resources from underperforming campaigns to those that deliver results, all without increasing overall spending.
"Marketing ROI isn't a destination; it's a journey of constant refinement." - Arham Khan, Founder and CEO, Pixated
Accurate attribution is the key to turning data into actionable insights. The difference between average and exceptional marketing teams often comes down to attribution accuracy. While many teams operate with only 30–40% accuracy, top-performing teams achieve 85–95%. As discussed earlier, robust attribution - enabled by consistent tracking - connects touchpoints directly to revenue. Tools like Madlitics help close the gap by capturing detailed source data, solving the "direct traffic" mystery, and integrating with CRMs to link marketing efforts to closed deals. This level of precision transforms vague attribution challenges into clear business cases, showing exactly how much revenue is recovered through better tracking.
Start with the essentials: clean UTM parameters, consistent tracking habits, and a 90-day attribution window. As your data matures, incorporate advanced multi-touch models to gain deeper insights. The aim isn’t to achieve perfection immediately but to build a system that becomes more precise and actionable with every campaign. By identifying the costs of inaction and focusing on high-return strategies, you can move beyond justifying budgets and start scaling what works.
Answers to your top questions