Resources

Attribution is broken and fixing marketing blindspots

Marketers don’t need perfect tracking; they need clearer signals.
Attribution is broken

Marketing attribution is in a weird place right now. We have more tools, more data, and more pressure than ever to “prove what’s working,” but most teams still feel like they’re guessing. The result is a lot of confident-looking dashboards that quietly hide some big blind spots.

Why attribution feels so broken

On paper, attribution should be the thing that finally tells you what’s driving real value. In reality, it often oversimplifies messy customer journeys and leans on incomplete data that doesn’t reflect how people actually buy.

Tools that once felt like a source of truth (*ahem* Google Analytics) struggle to keep up with multi-channel, cross-device, full-funnel behavior. A click from a Meta ad on mobile and a direct visit on desktop can look like two different people, while last-click reports keep handing credit to branded search and “direct” traffic. It’s not that those channels don’t matter, but they’re often standing on the shoulders of everything that came before.

The new blind spots nobody asked for

Attribution has never been perfect, but the last few years have made it even trickier. Privacy changes, cookie loss, and platform automation mean marketers are flying with fewer visible signals. Walled gardens like Google, Meta, and Amazon give you detailed performance inside their world, but not much help connecting the dots across everything else.

Then there’s dark social and zero-click behavior. People share links in private chats, discover brands through AI tools, or see a product on connected TV and buy days later on another device. All of that influence often shows up as “direct” or gets lost entirely. Add offline sales, cross-device journeys, and upper-funnel campaigns that rarely get last-click credit, and it’s easy to see how the gaps stack on top of each other.

Why teams keep clinging to old models

If the problems are so obvious, why do so many teams still lean on last-click-style reporting? Partly because it’s simple, and partly because it’s what stakeholders recognize. When budgets are on the line, it’s tempting to default to whatever feels concrete—even if everyone quietly knows it’s flawed.

Channel owners are stuck in the middle: ad platforms show one reality, analytics tools show another, and CRM data adds yet another perspective. Trying to explain incrementality, upper-funnel value, or why a lower-ROI campaign might actually be more incremental can turn into a multi-deck debate. Over time, many teams settle into a “good enough” mindset just to survive the conversation and keep work moving.

There are solutions

What better measurement looks like now

Fixing attribution doesn’t mean chasing a mythical, perfect model. The goal is to get closer to the truth, often by layering different approaches instead of relying on a single tool or report.

That might mean:

  • Running incrementality tests and geo holdouts to see what’s actually moving the needle.
  • Using marketing mix modeling for bigger, multi-channel budgets where simple click paths fall apart.
  • Combining modeled views with practical signals like branded search lift, pre/post testing, and customer surveys.

Underpinning all of that is clean, unified first-party data; especially around who converted, where they came from, and what journey they took before raising their hand. You don’t need perfect tracking; you need consistent, trustworthy inputs that help you make better calls on budget, strategy, and creative.

Where Madlitics fits into the picture

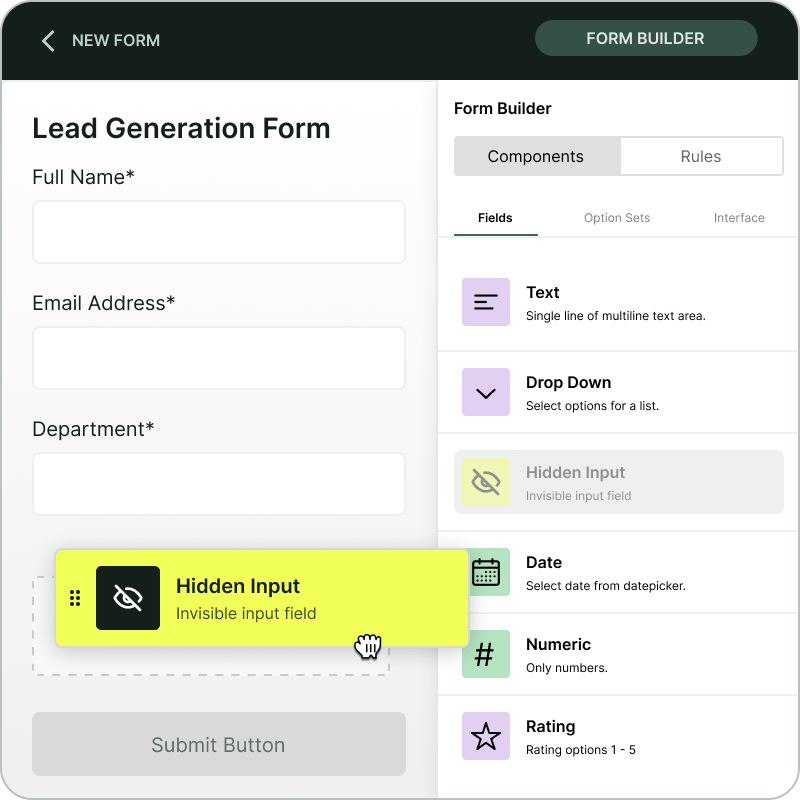
Instead of trying to be the one “true” attribution answer, Madlitics focuses on getting your first-party data in much better shape at the moment that matters most: when someone converts.

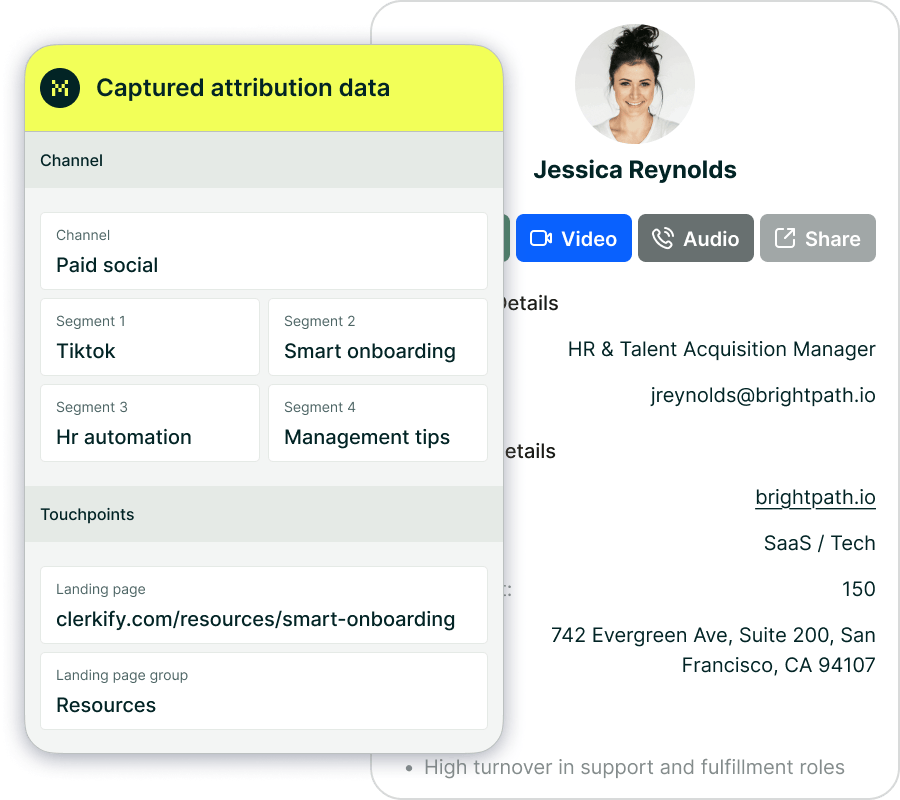
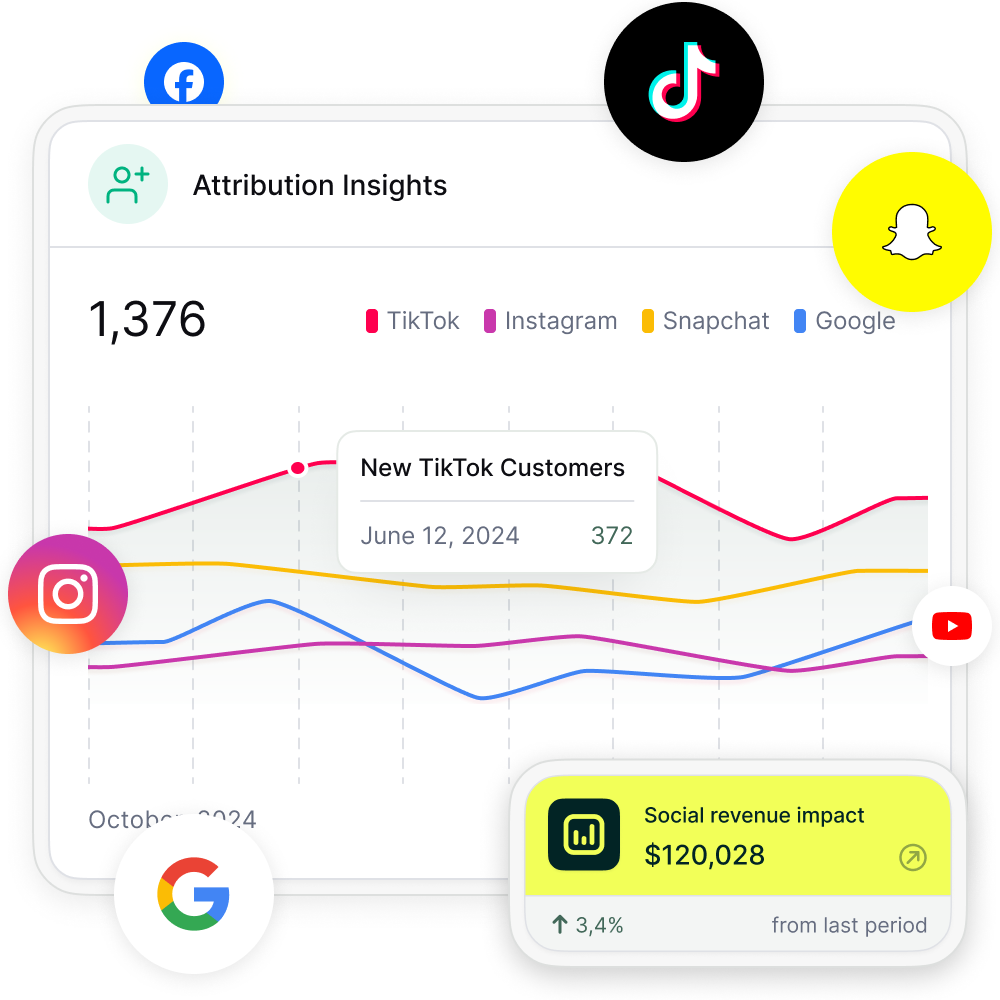
Madlitics enriches every form submission with details like channel, campaign, segment, keyword, and landing page, so you’re not guessing how someone arrived or which effort influenced the lead. That enriched data flows into your existing stack, giving you clearer visibility into what’s actually working without forcing you to rebuild everything from scratch.

Used alongside things like MMM, incrementality testing, and your existing analytics, Madlitics helps turn messy, fragmented journeys into something you can actually reason about—and defend when someone asks, “So… what’s really driving results?”

Madlitics multi-channel attribution visualization, showing marketing platforms like TikTok, Instagram, Google, and Facebook. The graphic highlights how different sources contribute to high-performing marketing channels.
1. Add UTM parameters to all inbound links
Any marketing effort that drives traffic — whether it’s a paid ad, an email campaign, or an organic post — should have properly structured URLs that clearly define the visitor’s origin. Setting it up is a straightforward process that starts with ensuring all inbound links include UTM parameters.

A LinkedIn campaign, for example, might link to:
https://yoursite.com/?utm_source=linkedin&utm_medium=paidsocial&utm_campaign=q1_promo
Screenshot of a form builder interface with a highlighted 'Hidden Input' field. Accompanied by text explaining how to install and set up Madlitics by adding hidden fields to capture marketing attribution data.
2. Add hidden fields
Once you’ve added UTM tracking to your inbound links, the next step is to install Madlitics on your site and update your Framer Forms to include hidden fields that will store attribution data when a visitor submits a form automatically. Hidden fields to include:
• Channel (e.g., Paid Search, Organic Social, Direct)
• Segment 1 (Platform name: Google, LinkedIn, Twitter)
• Segment 2 (Campaign name)
• Segment 3 (Ad group, offer name, or post type)
• Segment 4 (Creative type or ad variation)
• Landing page/group (Tracking & first-touch attribution)
CRM interface showing a detailed view of captured attribution data, including marketing channels, segments, and landing pages. A business profile of a lead is displayed, highlighting how Madlitics enriches lead data for sales and marketing teams.
3. Utilize attribution data
With the setup complete, every form submission in Framer now carries full attribution data, ensuring accurate insights into where leads originate. Pass this data to your CRM, analytics tools, or marketing automation platforms to track performance, refine campaigns, and optimize marketing efforts with precision.

Time to get real with your attribution

Attribution isn't going away, and neither are the blind spots—but you don't have to keep guessing in the dark. By layering incrementality tests, mix modeling, and rock-solid first-party data, you can start making decisions that actually move the needle, even if the picture isn't 100% crystal clear.

Tools like Madlitics make this easier by capturing full-funnel details right at form submission, turning vague "direct" traffic into actionable insights without ripping apart your stack. Pair that with team-wide buy-in and a willingness to challenge old dashboards, and you'll defend budgets with confidence while outpacing competitors stuck in last-click land.

The marketers winning in 2026 won't be chasing perfection, they'll be closing gaps, testing boldly, and iterating faster.

What's one blind spot you'll tackle first?

Related articles to get you started with Madlitics

Frequently asked questions

Answers to your top questions about our UTM parameters
Put attribution data to work
Sync, analyze, and automate — turn insights into action.
Automation icon indicating hands-free marketing attribution and data flow.
Sync with your CRM
Pass UTM parameters into Salesforce, HubSpot, or ActiveCampaign so your sales team knows exactly where every lead came from — no more guessing.
Analytics report icon, indicating data insights and reporting.
Built smarter reports
Use Google Sheets, Looker Studio, or Airtable to create data-driven reports that reveal which campaigns drive real revenue — helping you make informed budget decisions.
Impact measurement icon, symbolizing marketing effectiveness.
Track revenue impact
Sync UTM data with Stripe, PayPal, or Chargebee to see which campaigns generate paying customers, not just leads — so you can scale what works.
Personalization icon, representing customization features.
Personalize email campaigns
Trigger personalized email flows in Klaviyo, Mailchimp, or ConvertKit based on a lead’s original source — ensuring the right message reaches the right audience.
Visualizing your marketing impact
See how attribution data translates into actionable insights.
Stacked bar chart showing lead generation by marketing channel over time, comparing sources like Paid Search, Paid Social, Organic Search, Direct, and Email. Helps visualize which channels drive the most traffic.
Leads by channel
See how different marketing channels contribute to lead generation over time. Understand which ones drive the most traffic and whether your marketing mix is balanced. Shift your budget toward the highest-performing channels to maximize results.
Stacked bar chart illustrating lead volume across different marketing campaigns, including Black Friday, Retargeted, Spring Promo, Referral, and SEO. Highlights trends in campaign effectiveness.
Leads by campaign
Track inbound leads across all campaigns, whether or not they have UTM parameters. Ensure every lead is categorized correctly, including Organic and Referral traffic. Use this insight to refine messaging, targeting, and budget allocation for better performance.
Line chart displaying lead-to-customer conversion rates by channel, comparing Google Ads, Facebook Ads, LinkedIn Ads, Organic Search, and Email. Shows how different sources drive qualified leads over time.
Conversion rate by channel
See which channels convert leads into paying customers. Some bring buyers, while others generate unqualified leads. Focus your budget on what drives revenue.
Line chart showing revenue performance by marketing campaign, comparing Google Ads, Facebook Ads, and LinkedIn Ads. Helps identify top-performing and underperforming campaigns.
Revenue by campaign
Focus your budget on campaigns that drive revenue, not just leads. Identify top performers and optimize underperforming efforts to maximize profitability.
Everything you need for reliable lead attribution
Accurate, persistent, and automated tracking — so your campaigns perform at their best.
Performance icon symbolizing marketing campaign effectiveness and results tracking.
Outperforms basic UTM tracking
Madlitics captures, categorizes, and persists attribution data across sessions, giving you a complete, structured view of what’s working in your marketing. Say goodbye to losing attribution when users navigate your site, struggling with formatting inconsistencies, and ingored non-UTM traffic.
Capture icon indicating data collection from various marketing channels and sources.
Capture all traffic
Madlitics categorizes all inbound leads — whether they have UTM parameters or not — so every conversion is accounted for, and you won't miss out on Organic Search, Organic Social, and Referral traffic.
Routing icon representing the flow of marketing data and attribution pathways.
Attribution across pages and sessions
A LinkedIn ad click should be attributed correctly—even if the visitor signs up on a different page later. If someone clicks an ad, browses multiple pages, then submits a form later, Madlitics persists attribution data across sessions, ensuring your reports reflect true performance.
List icon representing structured marketing data, reports, or campaign breakdowns.
Cleaner, more reliable data
Duplicate UTMs and inconsistent formatting break reports and mislead teams. Madlitics cleans and organizes attribution data before sending it to your CRM, giving you accurate insights.
Target icon symbolizing precise audience targeting and marketing campaign focus
See which content converts
Attribution isn’t just about where visitors came from—it’s about what convinced them to convert. By capturing landing page data alongside UTM parameters, Madlitics shows you which blog posts, case studies, or pricing pages drive the most revenue, helping you scale content that works.
Action icon representing campaign execution, optimization, and engagement.
Transform form submissions into actionable insights
Madlitics connects marketing touchpoints to lead generation, ensuring every form submission is fully attributed — optimize ad spend by identifying high-ROI channels, refine messaging based on what content drives engagement, make data-driven decisions with clean, structured reports, and more.