Digital Marketing
How to track ROI by channel
Calculate true ROI, fix broken attribution, and use tools like Madlitics plus your CRM to shift budget from “busy” channels to the ones that reliably drive revenue.
Start capturing attribution →
Tracking ROI by channel helps you identify which marketing efforts truly drive revenue and which waste your budget. Many companies unknowingly misallocate 25–40% of their marketing spend due to poor data visibility and inaccurate attribution models. This guide simplifies the process, from calculating ROI to implementing tools for accurate tracking.
Here’s what you need to know:
(Revenue - Cost) / Cost × 100 for each channel, factoring in all costs like ad spend, software, salaries, and production.By refining your tracking system and aligning it with your sales cycle, you can reallocate budgets to high-performing channels, improve decision-making, and maximize profitability. For example, a software company boosted ROI by 32% in three quarters by reallocating funds based on accurate channel data. Stop relying on assumptions. Use precise tracking and attribution to turn marketing into a revenue driver.
ROI is all about turning spending into profit by directly connecting each dollar spent to measurable results. Without this clarity, budgets can quickly spiral out of control. In fact, about 47% of marketing budgets are wasted due to poor data visibility and inaccurate attribution.
But calculating marketing ROI isn’t as straightforward as standard financial metrics. Why? Because today’s digital customer journey is rarely linear. A potential buyer might first watch your LinkedIn video, later click a paid ad, and finally convert through organic search. Relying on last-click attribution oversimplifies this process, often missing the bigger picture. It’s no surprise that 73% of marketing leaders admit their attribution models fail to capture this complexity. Let’s break down how to calculate ROI and identify the metrics that truly matter.
The basic formula for ROI is simple: (Revenue - Cost) / Cost × 100. For example, if you spend $10,000 on a Facebook campaign and generate $35,000 in revenue, your ROI is 250% - meaning you earned $2.50 in profit for every dollar spent.
However, applying this formula across different channels is tricky. Each channel comes with its own set of costs. For example:
And don’t forget the "hidden" costs like agency fees, internal salaries, or software subscriptions. Overlooking these can lead to inflated ROI numbers that don’t reflect actual profitability.
For example, a $50 million e-commerce brand discovered that last-click attribution overstated their Google Ads campaign’s ROAS (Return on Ad Spend) at 4.5X. By switching to a first-party, multi-touch attribution model, the true ROAS was revealed to be just 2.1X. This highlights how platform-reported data often over-credits conversions, especially when 51% of CTOs and Chief Data Officers say platform data from Google or Meta isn’t fully reliable.
Once you’ve calculated ROI, these additional metrics can provide deeper insights into how each channel performs:
Moving beyond last-click attribution is crucial. Up to 95% of purchases can be tied to view-through conversions that last-click models overlook. For example, when Billy Footwear implemented multi-touch attribution in 2025, reallocating their budget based on the entire customer journey increased ad revenue by 72% year-over-year, with only a 7% increase in ad spend. That’s a 10.3× improvement in marketing efficiency.
Some channels don’t drive direct sales but amplify the performance of others. For instance, a LinkedIn video might not lead to immediate purchases, but it could boost organic search traffic or reduce PPC costs. Ignoring these nuances can lead to cutting top-of-funnel activities, triggering what’s known as the "Channel Death Spiral", where overall performance suffers.
Brands that track ROI comprehensively report 34% better budget allocation decisions, and fine-tuning these practices can increase marketing efficiency by up to 50%. Knowing which channels work - and how they work together - can mean the difference between wasting nearly half your budget and making every dollar count. This understanding is the first step toward setting up precise tracking and attribution, which we’ll explore in the next section.

After getting a handle on your metrics, the next step is to establish a tracking system that captures the origin of every lead. Without this, you're essentially flying blind. In fact, 40% of marketers say proving ROI is their biggest hurdle. Building this system starts with UTM parameters, progresses to integrating analytics tools with your CRM, and finishes with ensuring attribution across multiple sessions. This is crucial since the average B2B buyer interacts with 7–12 marketing assets over 3–6 months before taking action. Begin by tagging URLs with UTM parameters to gather detailed source data.
UTM (Urchin Tracking Module) parameters are small text snippets added to the end of URLs. They don't alter the destination but allow tools like Google Analytics 4 (GA4) to pinpoint which campaign, channel, or ad drove visitors to your site. Here's a quick breakdown of what each parameter does:
For instance, if you’re running a LinkedIn ad for a Q1 2026 product launch, your tagged URL might look like this:
https://yoursite.com/demo?utm_source=linkedin&utm_medium=cpc&utm_campaign=q1_2026_product_launch&utm_content=carousel_ad_v2
When users click this link, GA4 categorizes them accurately, letting you measure the ad’s performance. Consistency is key - GA4 is case-sensitive, so "Social" and "social" will appear as separate sources. Stick to lowercase, use underscores instead of spaces, and maintain a shared log for all campaign links.
Marketing specialist Alex Chen explains it well: "Campaign tracking is the process of adding a 'fingerprint' to your links... It transforms fragmented traffic data into a clear performance report".
One golden rule: never use UTM parameters on internal links. This can overwrite the original traffic source and mess up your attribution data. Once your UTM tracking is in place, the next step is connecting it with your CRM for a deeper understanding.
While UTM parameters reveal traffic sources, they don’t tie that traffic to revenue. By integrating GA4 (or similar tools) with platforms like Salesforce or HubSpot, you can track a lead’s journey from their first click to a closed deal - even if that takes six months.
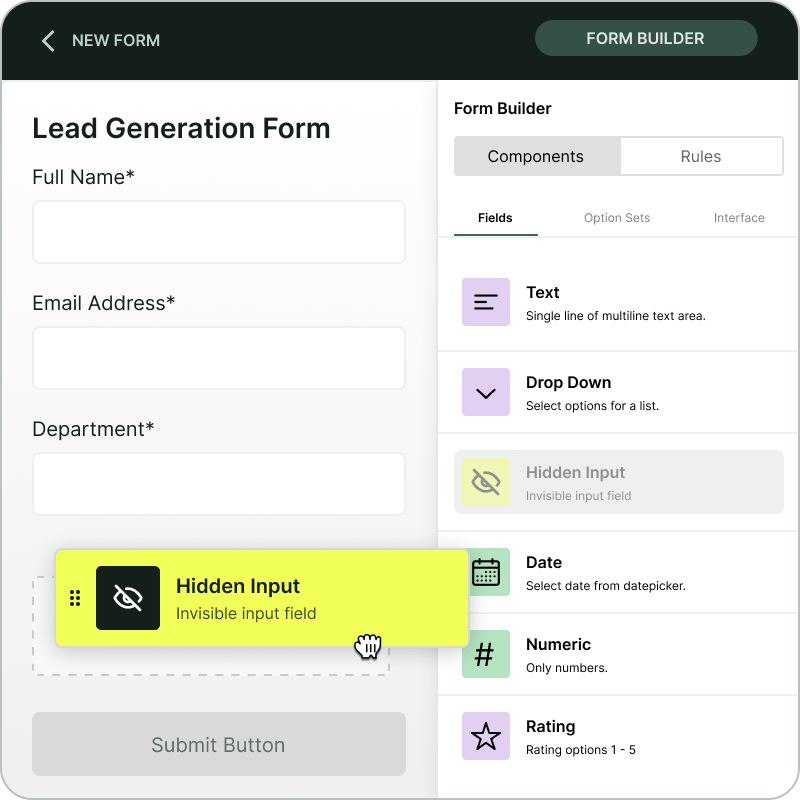
This requires setting up custom fields in your CRM to store UTM data. When someone fills out a form, hidden fields capture their utm_source, utm_medium, and utm_campaign values and save them in the CRM lead record. This allows you to see which channels drive marketing-qualified leads (MQLs), sales-qualified leads (SQLs), and revenue. Ensuring your CRM captures complete UTM data keeps your multi-touch tracking accurate.
A great example: In 2025, TripMaster, a transit software company, used CRM revenue dashboards to connect ad spend to pipeline performance. By tracking lead sources through to final sales, they generated $504,758 in new annual recurring revenue (ARR) in just one year.
Clean data is critical. Mistakes like inconsistent naming ("Email" vs. "email") can fragment your records. Enforce lowercase naming conventions and use tools like webhooks or native connectors to sync CRM stages (e.g., "Closed-Won") back to your ad platforms. A Q1 2025 survey found that 68% of B2B marketers struggle with accurate attribution, while 87% of those using a CRM said their strategies were effective - compared to just 52% of those without one. Pinpointing which lead sources drive revenue is far more impactful than chasing vanity metrics.
Most buyers don’t convert immediately. A typical journey might start with a LinkedIn ad on Monday, continue with an organic search on Wednesday, and end with a form submission from an email link on Friday. If your tracking system only records the last click, you’ll wrongly credit the email, even though LinkedIn initiated the process and search played a key assist.
This is where multi-touch thinking and persistent tracking come into play. In an average B2B SaaS buying journey with 7–12 touchpoints over 3–6 months, you need to understand the whole path—even if you still report using first‑touch or last‑touch models for simplicity. Multi-touch attribution doesn’t replace those models; it gives you context so you can interpret first‑touch and last‑touch ROI without being misled.
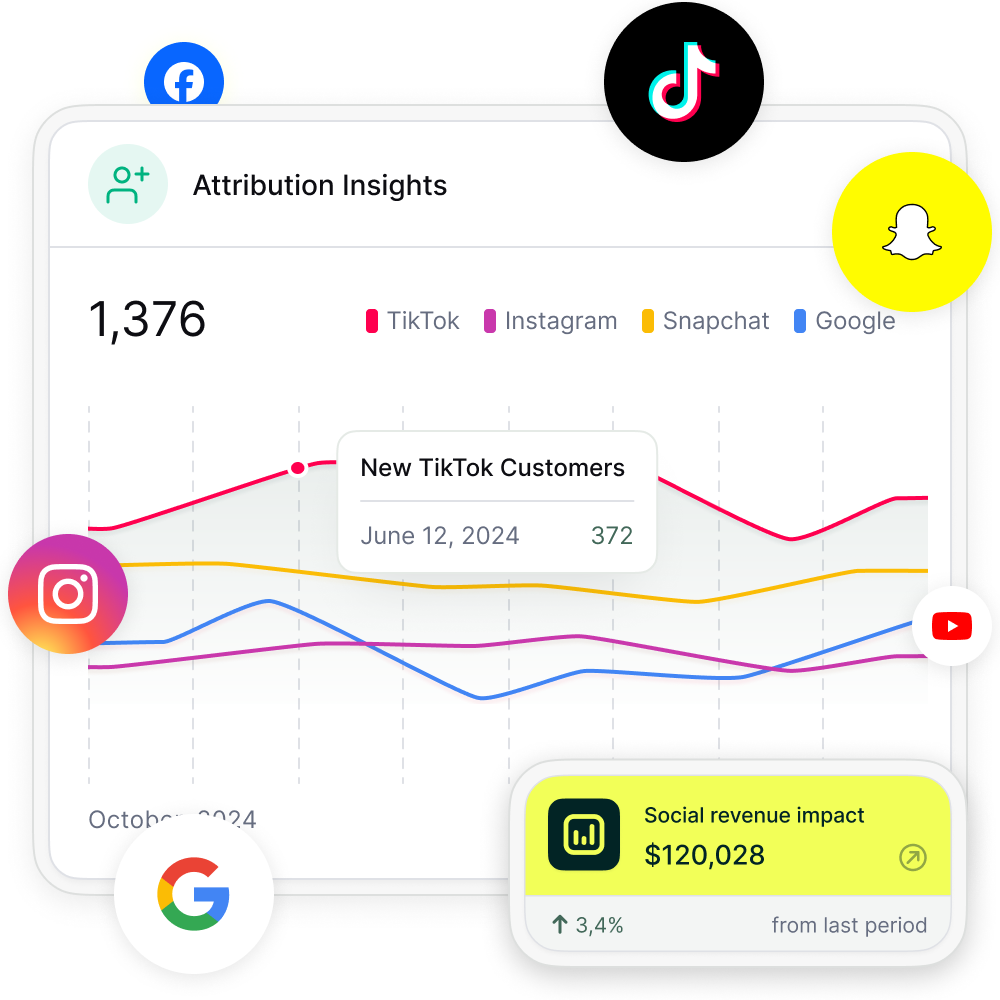
Tools like Madlitics help by making your first‑touch data durable across sessions. Instead of relying solely on fragile, session-based cookies, Madlitics captures the full first‑touch context (source, medium, campaign, landing page) when a visitor first arrives and then preserves that information until they submit a form. This ensures that even if a visitor interacts with your site multiple times before converting, you retain the original source information that kicked off the journey. You can then combine that first‑touch view from Madlitics with multi-touch analysis in your analytics or BI tools to see both who started the journey and which later touches helped close it.
For complex B2B sales, some platforms also offer account-based attribution, which aggregates touchpoints across an entire buying committee rather than tracking individual users. This can sit on top of a strong first‑touch foundation, giving you both a clean entry-point signal and a richer, account-level view of influence.
Finally, don’t overlook untrackable sources like word-of-mouth or private channels (e.g., Slack or communities). Adding a “How did you hear about us?” field to your forms can help capture this missing data and complement your quantitative attribution with self‑reported insight.
Session-based analytics tools are great at telling you what happened in a given visit, but they struggle to maintain a consistent story across devices, browsers, and long timeframes. Once a session ends or a cookie is reset, the original source is often lost and later conversions get lumped into “Direct” or “Unknown,” which quietly distorts your channel‑level ROI.
Persistent attribution takes a different approach. Instead of tying attribution strictly to sessions, it stores key first‑touch fields—like source, medium, campaign, and landing page—in a durable, first‑party record that can last for months. A tool like Madlitics captures that data as soon as a visitor first hits your site, keeps it stable across sessions, and then passes it into your forms and CRM at the moment of submission. The result is that channel ROI reflects the true origin of the journey, not just the last click that happened to coincide with the conversion.
In practice, the strongest setups use both: session-based analytics (e.g., GA4) for behavioral insights and multi-touch paths, and persistent first‑touch attribution (e.g., Madlitics) as the reliable backbone for channel‑level ROI and budgeting decisions.
After setting up UTM parameters and syncing your analytics with your CRM, the next step is finding the right tools for tracking ROI. The key is to choose a solution that provides accurate channel attribution, linking marketing efforts directly to revenue.
The best ROI tracking tools should cover all channels, organize data, integrate with CRMs, and handle multi-session journeys effectively.
Your tool needs to automatically track and categorize all incoming traffic, including organic search, social media, referrals, and direct visits. Businesses using tools with comprehensive ROI tracking capabilities report 34% better decisions when allocating their marketing budgets.
Data normalization is another crucial feature. It ensures that inconsistent UTM parameters - like "Summer_Sale" vs. "summersale" - don’t lead to fragmented reports. A good platform will clean and streamline this data before it reaches your CRM, so your ROI reporting stays consistent.
Integration with CRMs and revenue systems is essential for tracking how marketing touchpoints translate into actual revenue. Platforms like Salesforce, HubSpot, Stripe, or PayPal can help you measure profit rather than just leads. For instance, in 2025, TripMaster, a transit software company, used CRM dashboards to link ad spend directly to closed deals. This approach resulted in $504,758 in new annual recurring revenue within just one year.
In B2B, where buying cycles often involve 7 to 12 touchpoints over several months, multi-session tracking is equally important. If someone clicks a LinkedIn ad on Monday but converts through an email on Friday, your tool should still credit LinkedIn for starting the journey.
These features are the foundation for effective ROI tracking. Next, let’s see how these principles are applied in practice.
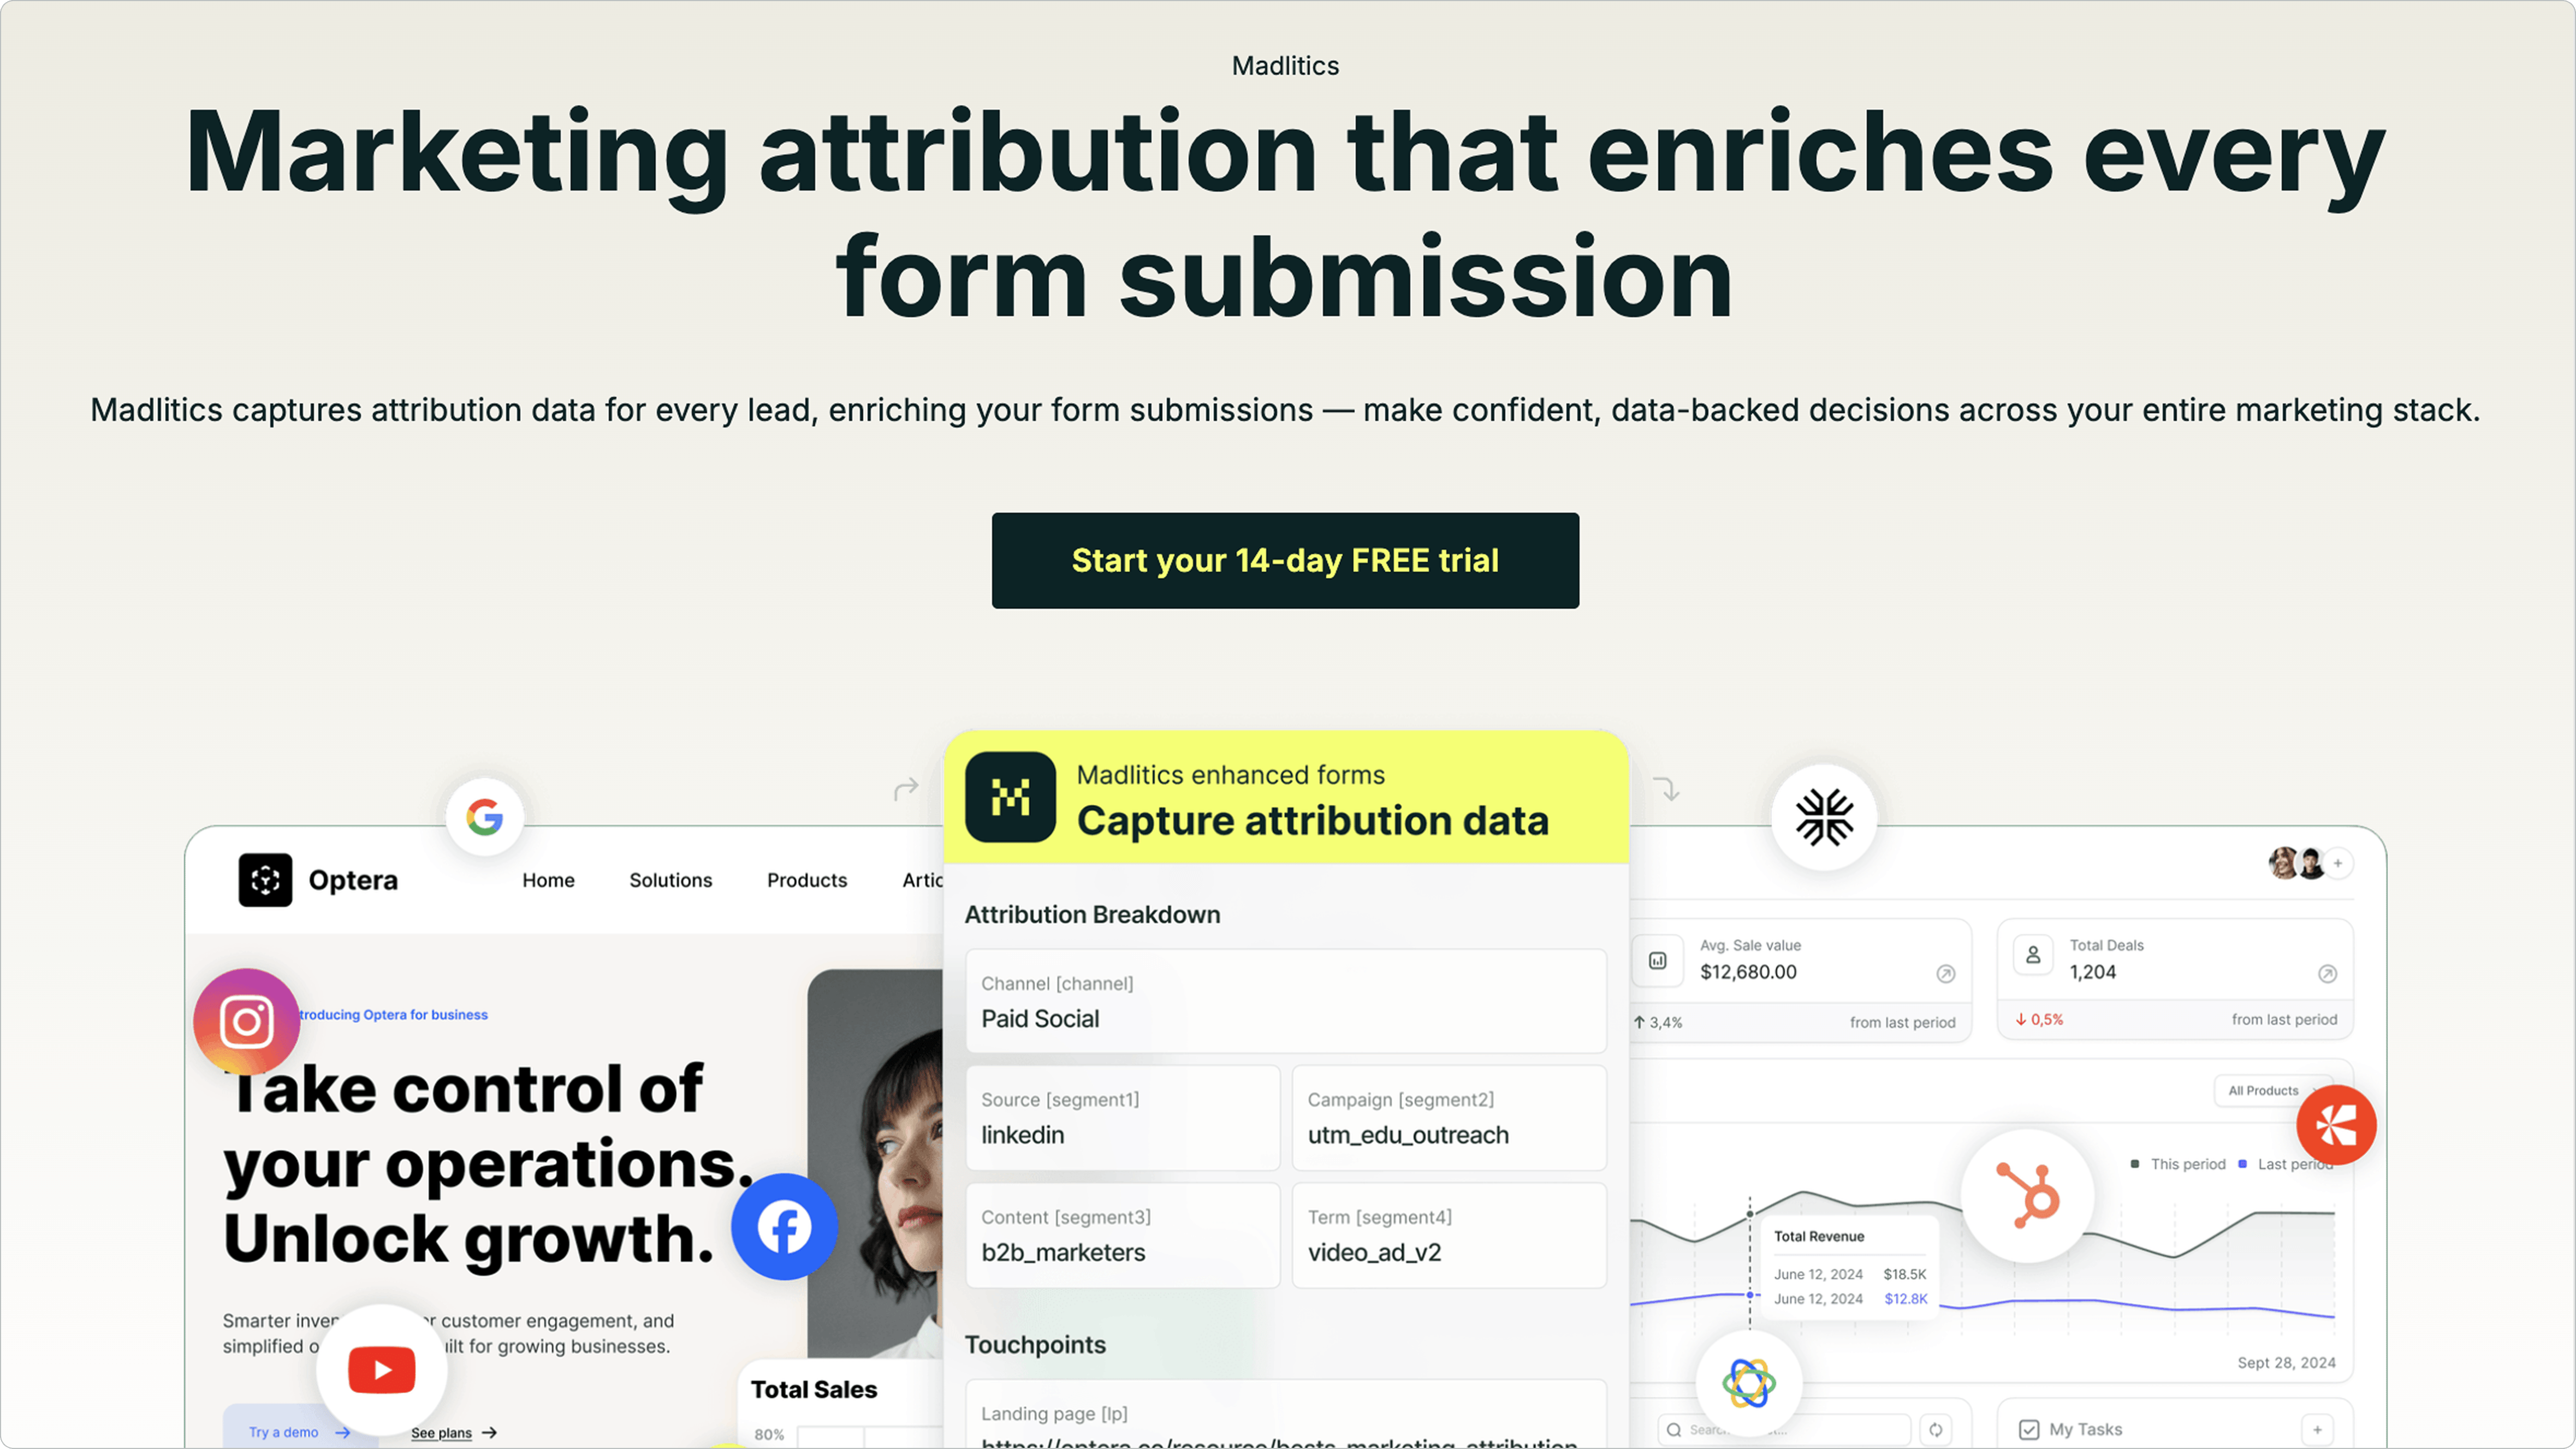
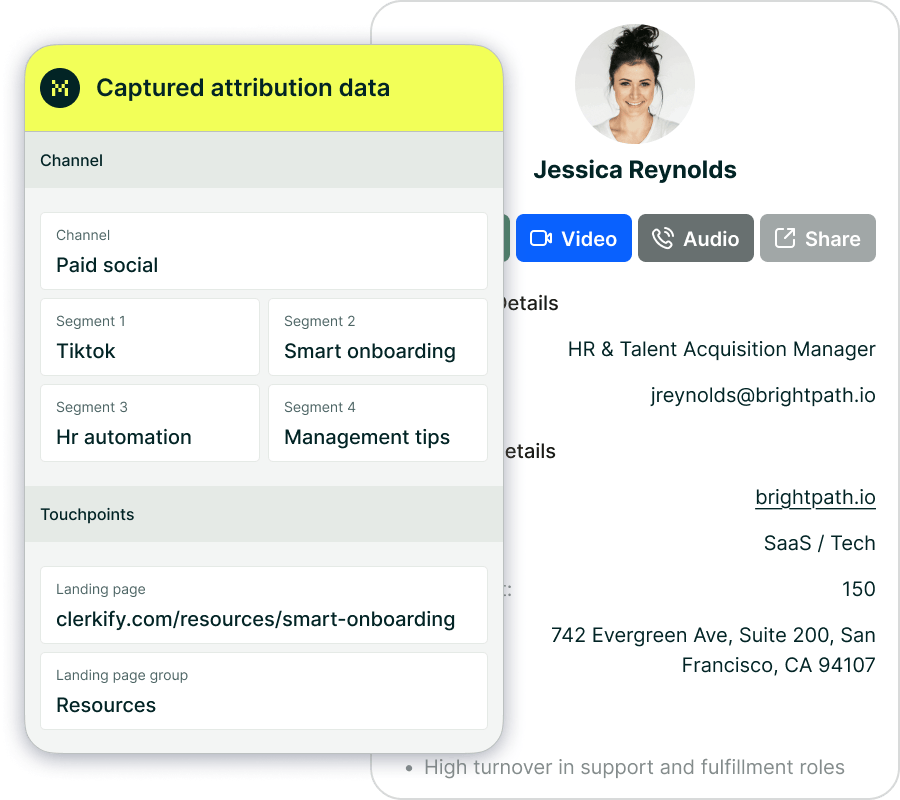
Madlitics addresses these challenges by capturing complete attribution data at the moment of conversion. Unlike tools that rely on incomplete cookies or UTM tags, Madlitics uses seven hidden fields - such as channel, campaign, keyword, audience, and landing page group - to automatically collect detailed marketing context when someone fills out a form.
This method solves the multi-session tracking problem. Even if a visitor interacts with your site across multiple sessions or pages, Madlitics retains the original source data, ensuring you always know where a conversion started. It also categorizes all traffic types, including organic and referral sources that might lack UTM parameters, so every conversion is accurately tracked.
The platform also cleans and organizes attribution data before syncing it to your CRM. Once integrated, you can connect this data to revenue tools like Stripe to identify which campaigns drive paying customers - not just leads. This closed-loop tracking shifts your focus from vanity metrics to actual profitability.
A VP of Marketing at a $50M e-commerce brand shared: "We were spending $200K monthly on Google Ads with a reported 4.5X ROAS. When we implemented first-party attribution, the true ROAS was 2.1X. We'd been losing money for 18 months".
Madlitics also simplifies decision-making with dashboards that display leads, conversion rates, and revenue by channel and campaign. This makes it easy to identify what’s working and adjust your strategy accordingly.
Getting started is straightforward: install a code snippet, add the hidden fields to your forms, and begin collecting data. Madlitics offers a 14-day free trial without requiring a credit card, so you can test the platform’s fit for your needs risk-free.
After setting up your tracking tools and attribution system, the next step is to calculate ROI for each channel and use that information to guide your marketing decisions.
Start with clean, accurate data by matching spend from platforms like Google Ads, LinkedIn, and Facebook to your CRM revenue. Be sure to include every cost - agency fees, subscriptions, content production, and salaries. Overlooking these hidden expenses could lead to underestimating your marketing costs by 40% to 60%.
To avoid fragmented reports, standardize your channel definitions. For example, ensure "Paid Social" means the same thing across LinkedIn data and CRM records. Reconcile your marketing spend monthly with your Finance team to align with the company’s profit and loss statement.
For B2B companies with longer sales cycles, cohort-based analysis is critical. Instead of focusing only on deals closed this month, track leads by their acquisition month and measure their revenue impact over time. This approach accounts for the lag between when leads enter the funnel and when they convert. Once your data is standardized and complete, you can choose the right attribution model.
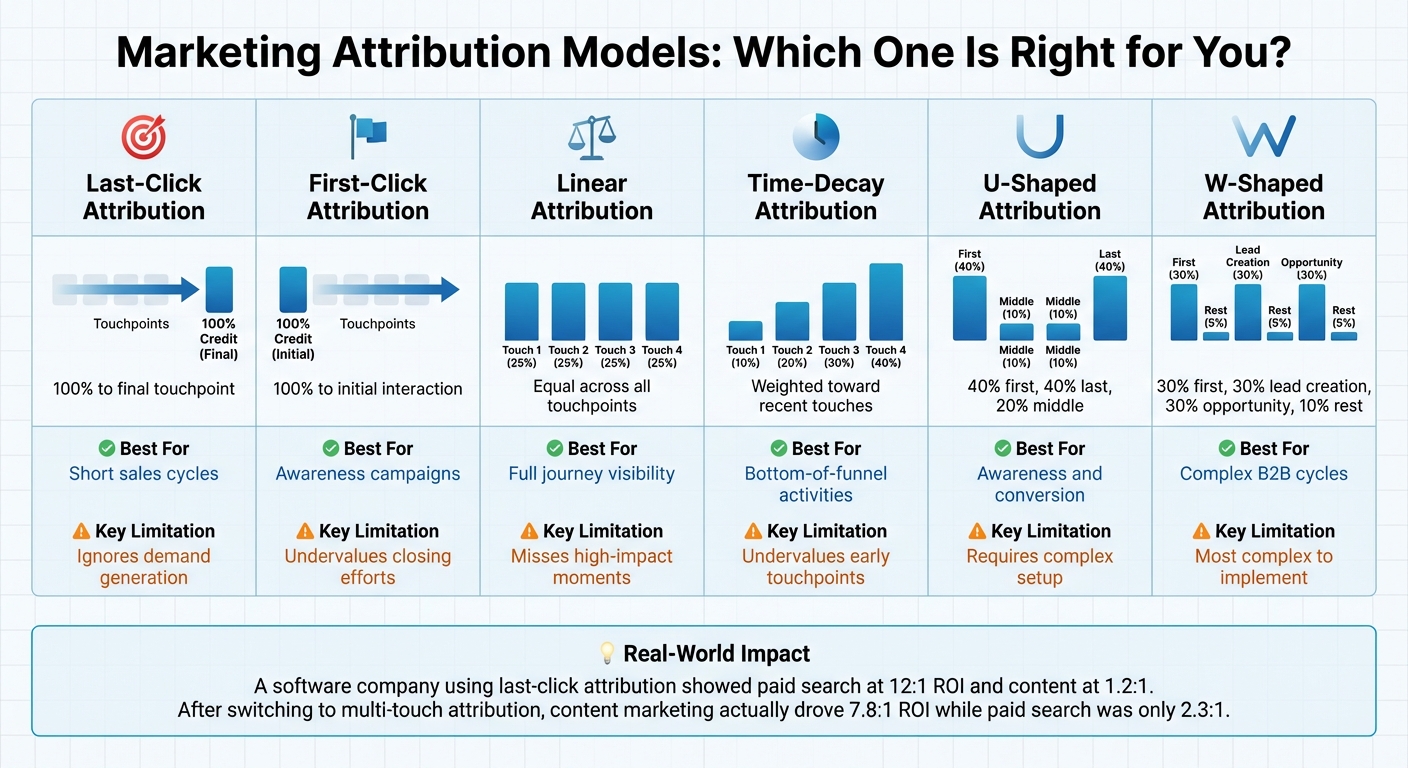
Attribution models help you assign credit to various touchpoints in a customer's journey. The right model depends on your sales cycle and goals.
For B2B organizations, position-based models like U-shaped or W-shaped attribution often provide better insights. U-shaped attribution assigns 40% credit to the first and last touchpoints, with the remaining 20% spread across the middle. W-shaped attribution goes further, allocating 30% to the first touch, 30% to the opportunity creation moment, and 30% to the final conversion, with 10% distributed across other touchpoints. These models balance credit between the channels that initiate and close the customer journey.
Here’s a quick comparison of attribution models:
In a 2025 project, Marqeu worked with a large software company whose last-click attribution showed paid search with a 12:1 ROI and content marketing at just 1.2:1. After switching to multi-touch attribution, the results flipped: content marketing drove a 7.8:1 ROI, while paid search dropped to 2.3:1. The analysis revealed that most paid search conversions began with content consumption 3-6 months earlier.
Once you’ve chosen an attribution model, you can begin turning your data into actionable insights.
ROI data helps refine your strategy. Look for patterns in your reports. Which channels consistently deliver strong returns? Which ones bring in leads that never convert?
For example, a global software company found that two channels driving 40% of their leads contributed less than 15% of revenue after proper ROI tracking. Insights like this allow you to reallocate budget from underperforming channels to those delivering better results.
Align your analysis period with your sales cycle. If your average deal takes six months to close, evaluate ROI over a rolling 12-month period. This gives campaigns enough time to show their full impact and avoids prematurely cutting effective channels.
For subscription-based businesses, calculate ROI using Customer Lifetime Value (CLV) rather than just the initial contract value. A channel that seems costly per lead might actually bring in long-term customers who spend more over time.
"Without calculating ROI per channel, you risk pouring budget into activities that look busy but do not actually drive profit." - GrowthRocks
Tailor your ROI reports to different stakeholders. Executives need high-level metrics like customer acquisition cost and total revenue. Your tactical team benefits from MQL-to-SQL conversion rates by source, while your operations team needs landing page conversion rates. Providing tailored views ensures everyone has the insights they need to make informed decisions.


Measuring ROI for each marketing channel boils down to three key factors: accurate data, reliable tools, and ongoing analysis. Start by creating a standardized approach to define and measure your channels across all platforms. Make sure to account for all costs - this isn't just about media spend; include agency fees, content creation, and team salaries. Then, choose an attribution model that fits your sales process, whether that's U-shaped for balancing early and late-stage impact or W-shaped for more intricate B2B journeys with multiple touchpoints.
Once you've established consistent metrics, selecting the right tools becomes critical. Manual tracking often overlooks important interactions, especially in long customer journeys. Tools like Madlitics simplify this by automating attribution data collection, giving you a complete view of your leads' paths. No more manual guesswork or frustrating data gaps - just a clear, streamlined picture of how your channels are performing.
Regular reviews, ideally monthly, help you stay aligned with revenue goals. These check-ins let you spot trends and identify which channels are driving revenue, not just generating leads. For instance, in 2024, Vendr, a software company, introduced real-time attribution dashboards. This move saved them 2–3 days of manual analysis each month and led to an impressive 8.6x boost in ROAS.
"When your campaign structure, demand generation programs, and measurement strategy are aligned, channel-level ROI becomes an everyday decision tool, not just an annual budget conversation." - The Pedowitz Group
Answers to your top questions