Digital Marketing
Marketing Attribution Models: 7 Types Explained
Marketing Attribution Models: 7 Types Explained
Start capturing attribution →
Marketing attribution models help you figure out which marketing efforts lead to sales. They assign credit to various customer touchpoints - like ads, emails, or social media - so you can understand what’s working and optimize your budget.
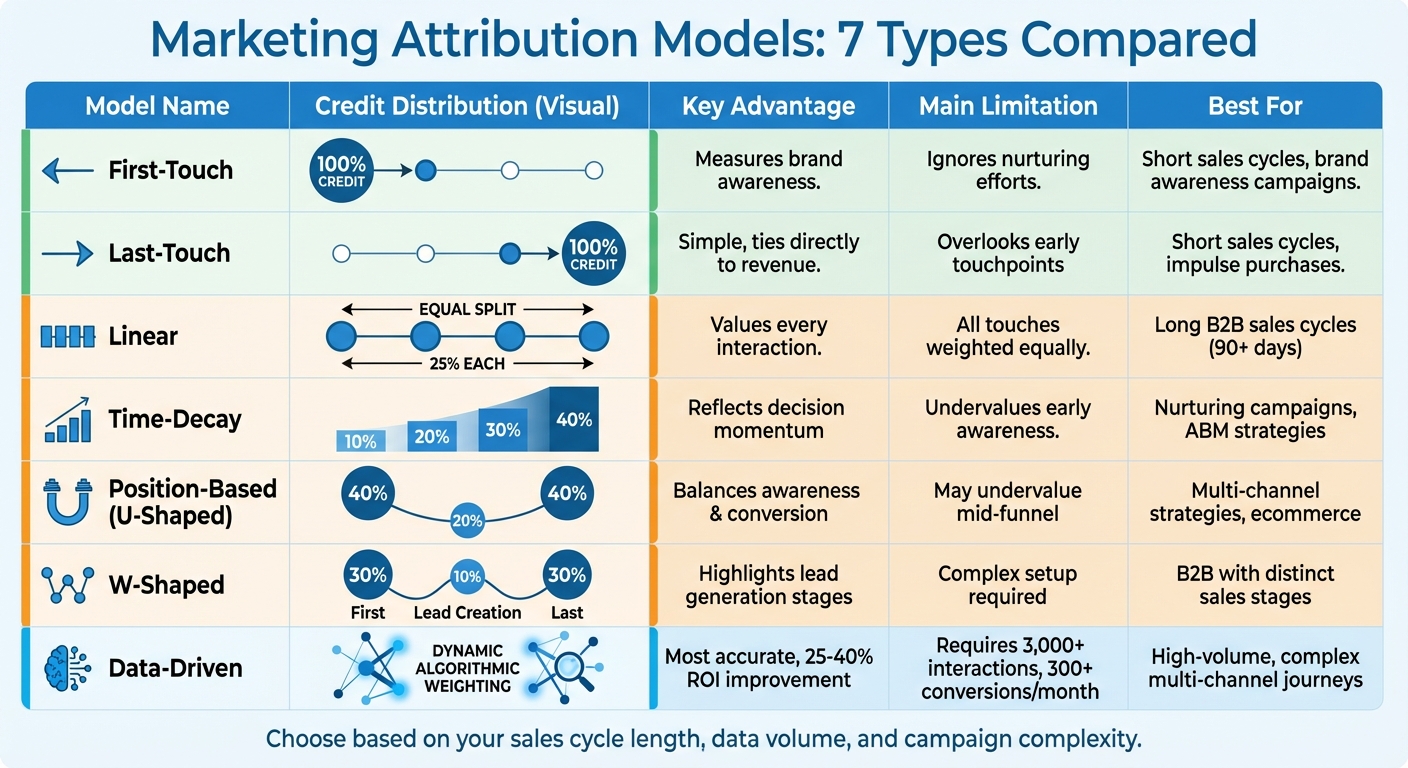
Here’s a quick breakdown of 7 attribution models:
Each model has pros, cons, and ideal use cases. Choose based on your sales cycle, customer journey, and available data. For complex campaigns, multi-touch or data-driven models provide deeper insights.
The first-touch attribution model gives 100% credit to the very first interaction a customer has with your brand. Every touchpoint that follows - emails, retargeting ads, or any other engagement - gets no recognition.
As Mountain explains:
"The initial connection between a customer and your brand is the most important, as no subsequent touchpoints could have occurred if not for that initial engagement".
For instance, if someone discovers your brand through a Facebook ad, that ad is credited entirely for the conversion - even if follow-up emails or other touchpoints help close the deal.
One of the biggest advantages of this model is its simplicity. It’s easy to set up and provides clear insights into which channels are driving initial brand awareness. This makes it particularly useful for identifying the effectiveness of your top-of-funnel strategies.
However, there’s a downside: it ignores the rest of the customer journey. By focusing only on the first touch, you might overlook critical interactions that actually lead to a conversion. This can lead to an unbalanced budget, favoring awareness channels over nurturing efforts. In industries with complex B2B sales or long decision-making processes, where months might pass between the first touch and the final purchase, this model often fails to capture the full picture of what drives revenue.
This model is ideal for campaigns with short sales cycles and low-cost products, where customers are likely to convert after just one or two interactions. It’s especially useful for:
However, for sales cycles exceeding 90 days, this approach tends to miss the importance of ongoing engagement and top-of-funnel activities that nurture leads over time.
The last-touch attribution model assigns 100% of the conversion credit to the final interaction a customer has with your brand before making a purchase. Any earlier touchpoints are completely disregarded in this approach.
As the MNTN Team explains:
"The last-touch attribution model considers a customer's last touchpoint with your company to be the most meaningful."
A popular variation of this is the "last non-direct click" model. This version skips over direct traffic - like when someone types your URL directly - and instead credits the last marketing channel the customer engaged with. This tweak provides a slightly clearer view of which marketing efforts are driving conversions.
The main appeal of the last-touch attribution model lies in its simplicity and its clear link to revenue. It’s the default option for many analytics platforms because it’s easy to implement and identifies the channel that ultimately closed the sale. In fact, 41% of marketers rely on this model.
But there’s a downside: this simplicity overlooks how customers typically engage with a brand multiple times - often six to eight touchpoints - before they finally convert. Early interactions, such as SEO campaigns or educational content, are ignored, which can lead to misaligned budgets and missed opportunities.
The Twilio Segment team puts it this way:
"Last-touch attribution is popular because, on the surface, it makes sense. What matters most is what finally caused the conversion, right? But if you dig a little deeper, you start to notice that it doesn't paint the full picture."
Last-touch attribution shines in scenarios with short sales cycles, where customers make decisions quickly - often within hours or days. It’s particularly effective for impulse-driven purchases, mobile app installs, or flash sales, where the final interaction is crucial. It’s also useful for evaluating bottom-funnel tactics like discount codes, retargeting ads, or promotional emails.
However, this model falls short for complex B2B sales or high-ticket items, where the sales process can stretch over 90 days. In these cases, multiple stakeholders and a series of interactions contribute to the final decision, making last-touch attribution too narrow in scope. For such scenarios, it’s better to use last-touch attribution as a quick, tactical tool while combining it with more robust methods, like Marketing Mix Modeling, for strategic budgeting.
Next, we’ll dive into alternative multi-touch models that distribute credit more evenly across the customer journey.
The linear attribution model spreads the credit evenly across all touchpoints in a customer’s journey. For instance, if a customer interacts with four different channels before making a purchase, each channel gets 25% of the conversion credit (calculated as 1/n, where "n" represents the total number of touchpoints). David Broderick from MarTech explains it well:
"Linear attribution splits conversion credit equally across every marketing channel a customer interacts with. Think of it as giving every player on your marketing team equal recognition for the win."
This method ensures that early awareness-building efforts and mid-funnel activities are valued just as much as the final conversion step. Unlike single-touch models, it recognizes every interaction along the way.
The linear model avoids the extremes of first- or last-touch attribution by evenly valuing every interaction. It’s straightforward to set up and is often included as a default in analytics tools. However, it assumes all interactions are equally impactful - a quick social media scroll doesn’t necessarily match the influence of a detailed product demo request.
Susie Marino from WordStream highlights another advantage: it ensures no touchpoints are ignored, addressing the common issue where only the first or last interaction gets credit. Additionally, the linear model doesn’t require advanced algorithms or data expertise.
That said, spreading credit thinly across many touchpoints can make it harder to pinpoint which specific interactions are driving results. The model also overlooks the "recency effect", where touchpoints closer to the conversion event often have a stronger impact.
Linear attribution works well for businesses with long sales cycles, such as B2B enterprise software or professional services, where multiple touchpoints over 90 days or more are common. It’s especially useful for maintaining steady brand visibility rather than focusing solely on the final step in the sales process.
For smaller marketing teams without access to advanced analytics, this model provides an accessible way to analyze multi-touch journeys with minimal complexity. However, for campaigns with over 10–15 touchpoints, a position-based or time-decay model might be better to avoid spreading credit too thin. Many marketers use linear attribution as a starting point, comparing its results with first-touch or last-touch models to better understand which channels drive awareness versus conversions.
The time-decay attribution model spreads credit across all touchpoints in a customer's journey but gives more weight to those closer to the conversion. It uses the formula y = 2^(-x/half-life), where x represents the number of days before the conversion. For example, with a 7-day half-life, a touchpoint 7 days prior to conversion gets 50% of the credit, while one 14 days out receives only 25%. For longer sales cycles, you can extend the half-life to 30 or 45 days, adjusting how credit is allocated over time. This approach ensures that recent interactions carry more influence in performance analysis.
This model shines when it comes to recognizing mid-funnel activities, like nurturing campaigns, which are often ignored by last-touch models. By emphasizing recency, it highlights the importance of touchpoints that occur closer to the conversion. However, it tends to undervalue early-stage efforts, such as display ads or social media campaigns that initially sparked interest. Additionally, implementing this model can be more complex compared to simpler attribution methods.
For marketers, this means the model is particularly useful for justifying investments in strategies like email campaigns, webinars, or content downloads that help maintain engagement and push prospects toward a sale. However, it might not fully capture the value of top-of-funnel channels that played a role earlier in the journey.
The time-decay model is ideal for long B2B sales cycles, where decision-making involves multiple stakeholders over an extended period. For instance, 71% of B2B buyers download several pieces of content while evaluating their options, making this model valuable for tracking these prolonged interactions. It’s also a great fit for Account-Based Marketing (ABM) strategies, where touchpoints tend to grow in importance as relationships with key accounts deepen.
For industries or scenarios involving high-consideration purchases and extended sales cycles, this model provides a realistic way to weigh touchpoints as they build momentum toward conversion. On the other hand, for short sales cycles, another attribution model may better capture the influence of each interaction.
The position-based attribution model, often called the U-shaped or bathtub model, emphasizes the importance of the first and last touchpoints in a customer's journey. It assigns 40% of the conversion credit to the first touchpoint and another 40% to the last touchpoint, with the remaining 20% divided equally among all middle interactions. If there are only two touchpoints, the middle 20% is split between the first and last touchpoints. This setup acknowledges that while the opening and closing interactions are critical, the middle steps also contribute value. As the MNTN Team puts it:
"This balanced distribution helps you understand how customers are initially attracted to your brand, what keeps them engaged, and what finally convinces them to make a purchase".
This structured allocation provides a clear framework for evaluating the strengths and weaknesses of the model.
The position-based model offers a balanced perspective, making it easier to justify spending across both awareness and conversion-focused efforts. Unlike single-touch models, it encourages investment in multiple stages of the customer journey. By doing so, it helps prevent over-prioritizing either awareness or conversion channels.
However, the fixed 40-40-20 split may not fit every customer journey. For instance, mid-funnel activities like product demos or consultation calls might not get enough recognition because they share just 20% of the credit. David Broderick notes:
"While this 40-40-20 distribution is common, you can adjust the percentages to better reflect your specific customer journey and business objectives" .
Adjusting the model periodically - such as every quarter - can help align it with evolving marketing strategies.
Given its balanced approach to credit allocation, this model is particularly effective for products or services with longer sales cycles (over 90 days), where maintaining awareness over time is crucial [4]. It shines in omnichannel strategies that layer different approaches, such as pairing TV ads with paid search campaigns.
Additionally, the position-based model works well for ecommerce businesses with repeat customers and for B2B or service-based companies, where the first interaction often generates the lead and the final touchpoint closes the deal. Its ability to highlight both awareness and conversion makes it a versatile choice for many marketing scenarios.
The W-shaped attribution model takes a more nuanced approach to assigning credit compared to linear, time-decay, or position-based models. It focuses on three pivotal moments in the customer journey: first touch (initial brand awareness), lead creation (when a prospect shares their contact information), and opportunity creation (the final interaction before conversion). Each of these milestones gets 30% of the credit, while the remaining 10% is evenly distributed across all other touchpoints.
As the MNTN Team puts it:
"W-shaped attribution assumes that your most important touchpoints are those that build brand awareness, those that identify a need for your potential customers, and those that inspire them to convert."
For example, in a six-touch customer journey, the three milestones would each receive 30%, and the leftover 10% would be divided among the other touchpoints. This structured distribution ensures that key moments in the funnel are prioritized.
The W-shaped model offers a detailed picture of the marketing funnel by emphasizing the awareness, consideration, and conversion stages. This can help marketing and sales teams stay aligned, as it clearly tracks a prospect's progression from initial interest to becoming a lead and, eventually, a conversion opportunity. Such clarity makes it easier to evaluate and optimize marketing efforts across multiple funnel stages.
That said, this model isn’t without its challenges. Identifying which touchpoints qualify as lead or opportunity creation can be subjective, leading to inconsistencies. Additionally, by giving limited credit to interactions after the opportunity stage, it risks undervaluing efforts aimed at retention or post-conversion engagement. To avoid such pitfalls, marketers need to clearly define what constitutes each milestone - whether it’s downloading a whitepaper, attending a webinar, or requesting a demo - and ensure consistent tracking.
The W-shaped model shines in B2B and SaaS industries, especially when dealing with lengthy sales cycles that include distinct stages like lead qualification and conversion. It’s particularly effective for high-consideration purchases, such as enterprise software or expensive appliances, where customers typically spend time researching before making a decision.
On the other hand, this model is less practical for shorter sales cycles or impulse buys, where the journey from awareness to purchase happens quickly and lacks distinct phases. For businesses with longer decision-making processes, where milestones can be clearly identified, the W-shaped model provides an excellent framework for tracking and optimizing key interactions.
The data-driven attribution model stands apart from traditional models by relying on machine learning to analyze actual conversion data. Instead of following fixed rules, it evaluates which touchpoints genuinely influenced a sale by comparing paths that led to conversions with those that didn’t. This approach uses real-time data to refine how credit is assigned, making it far more precise than earlier models.
At its heart, the model employs a "counterfactual approach" - it evaluates what happened and contrasts it with what might have happened if a specific touchpoint were removed. This method ensures that the credit assigned is tailored specifically to your business, adapting continuously as more data becomes available.
The model doesn’t stop there. It factors in variables like the timing of interactions, the devices used, the sequence of ads, and even the creative elements involved. Neil Patel, Co-Founder of NP Digital, sums it up well:
"Data-driven attribution uses machine learning to identify how much credit each of your different marketing channels should get for generating a sale, lead, or signup".
Unlike static models such as linear or position-based approaches, data-driven attribution assigns fractional credit based on the actual likelihood that a touchpoint influenced the outcome. This dynamic method evolves as customer behavior and data patterns shift, offering a continually refined view of attribution.
The primary advantage of this model is its precision. Businesses using data-driven attribution often see 25-40% improvements in ROI accuracy compared to those relying on standard models. By eliminating human bias, it delivers granular insights into the performance of specific keywords, placements, and even individual creative assets. And because it learns from new data, the model becomes increasingly accurate over time - an asset for businesses with growing or changing marketing strategies.
That said, there are some challenges. The model demands a large volume of data to work effectively. Google Ads, for instance, recommends at least 3,000 ad interactions and 300 conversions within 30 days to produce reliable results. For smaller businesses or new campaigns, reaching this threshold can be a hurdle. Another drawback is the model’s "black box" nature - you see the outcomes but often can’t discern the exact calculations behind them. Additionally, it struggles to account for offline factors like word-of-mouth or brand reputation, which leave no digital trace.
This model shines in scenarios with complex, multi-channel customer journeys. If your customers interact with your brand through social media, email, search ads, and display campaigns before converting, data-driven attribution is ideal for identifying which channels deserve credit. It’s particularly effective for B2B companies, where sales cycles are longer and involve multiple touchpoints over weeks or even months.
Brands running omnichannel strategies across various devices and platforms will also benefit, as the model provides a comprehensive view of how different channels work together. For those using automated bidding in Google Ads, data-driven attribution can reallocate credit to better-performing campaigns in real time, optimizing results. Notably, in October 2023, Google made data-driven attribution the default model in Google Ads and GA4, signaling a shift in industry standards.
However, this model is less effective for businesses with short sales cycles or low conversion volumes. For products with quick purchase decisions, simpler models like last-touch or first-touch might be more practical until you gather enough data to switch to a more sophisticated approach.
The table below serves as a handy reference to help you compare attribution models. The right choice depends on factors like your sales cycle, campaign objectives, and the complexity of your customer journey.
Key Considerations
Single-touch models, like First-Touch and Last-Touch, are straightforward but often oversimplify customer journeys. On the other hand, multi-touch and data-driven models offer richer insights but demand more data and resources.
As BJ Cook, President of 85Sixty, wisely points out:
"Don't get stuck picking the perfect model. Ask what you need from attribution and make sure your team is comfortable with the logic."
Start with a model that aligns with your current sales cycle and resources. As your data capabilities and marketing strategies evolve, you can transition to more advanced models.


Choose an attribution model that aligns with your sales cycle, customer journey, and business goals. For shorter campaigns, like e-commerce promotions, single-touch models can provide quick insights. On the other hand, longer B2B cycles with multiple touchpoints benefit from multi-touch models, which offer a clearer picture of the entire engagement journey.
Begin with a model that fits your current resources and objectives, and adjust as your data capabilities expand. For sales cycles exceeding 90 days, relying solely on first-touch models can lead to missed insights into mid-funnel interactions and closing activities. Reviewing your attribution model every quarter ensures it stays aligned with evolving strategies and channels.
Today, 63% of marketing leaders report increased pressure from CFOs to prove campaign effectiveness, compared to 52% in 2024. This highlights that accurate attribution is no longer just about understanding performance - it’s about demonstrating ROI and justifying budgets with confidence.
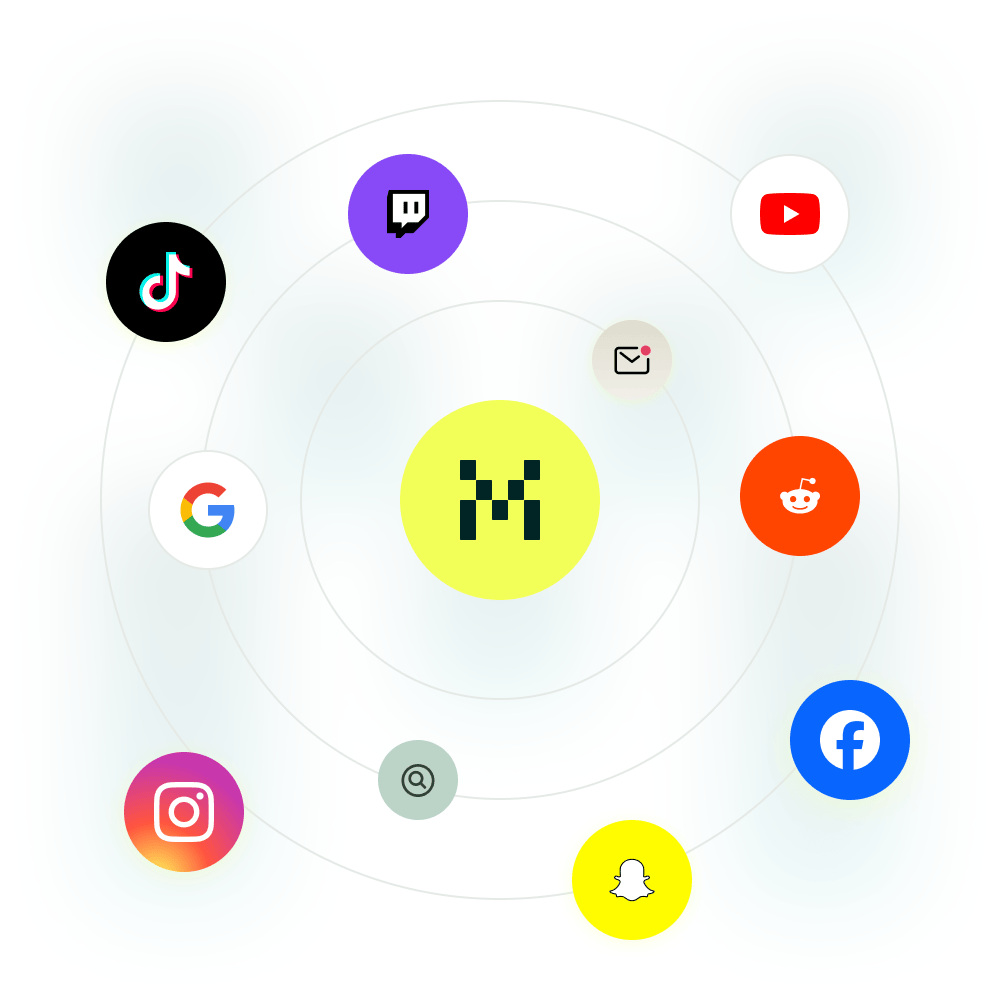
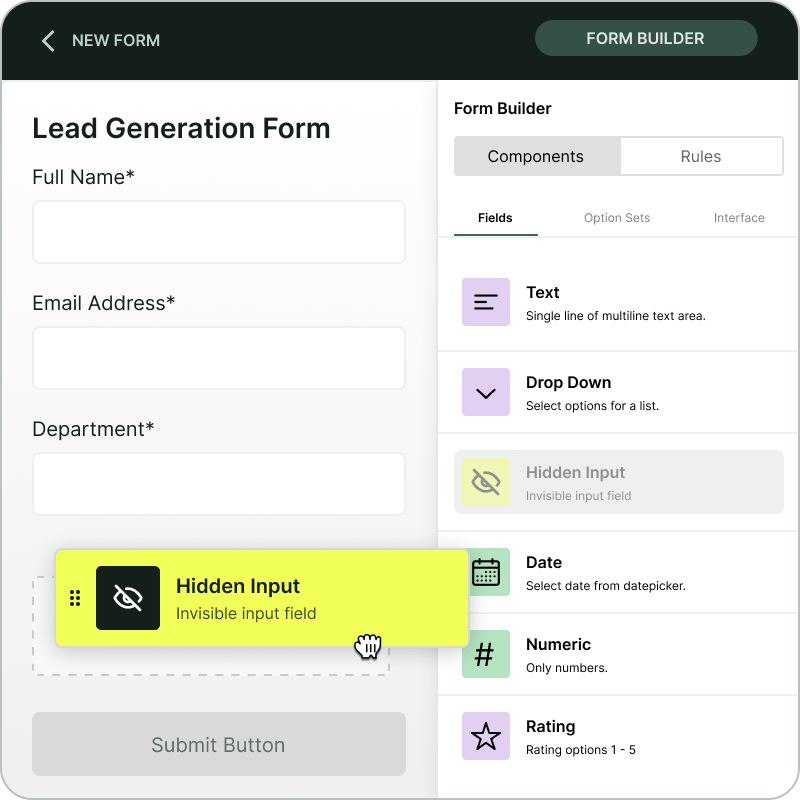
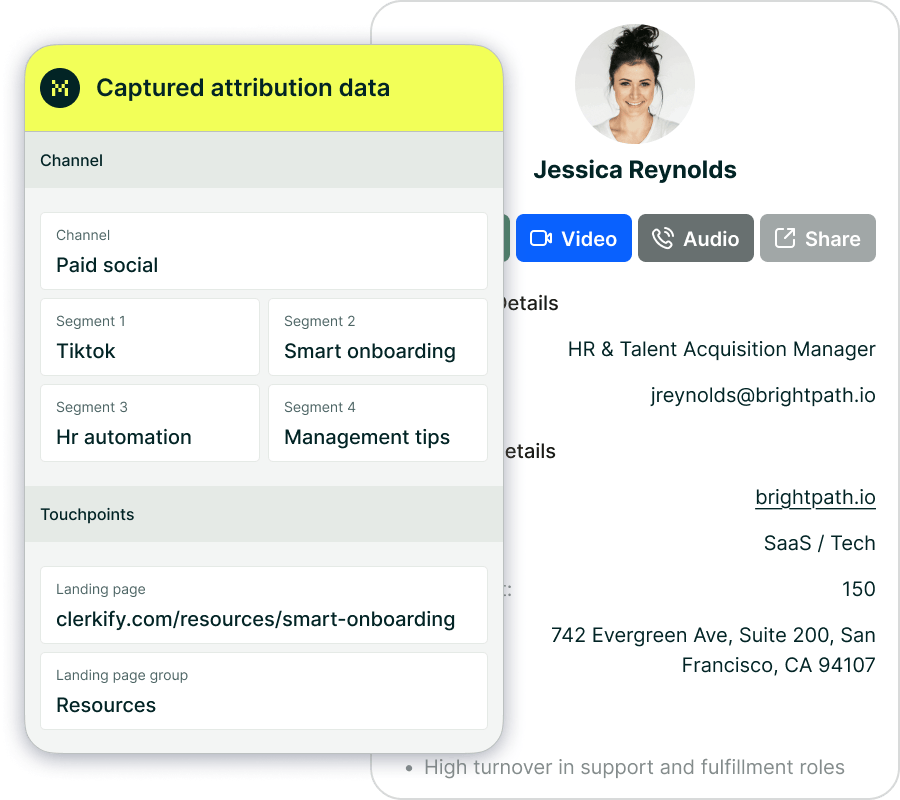
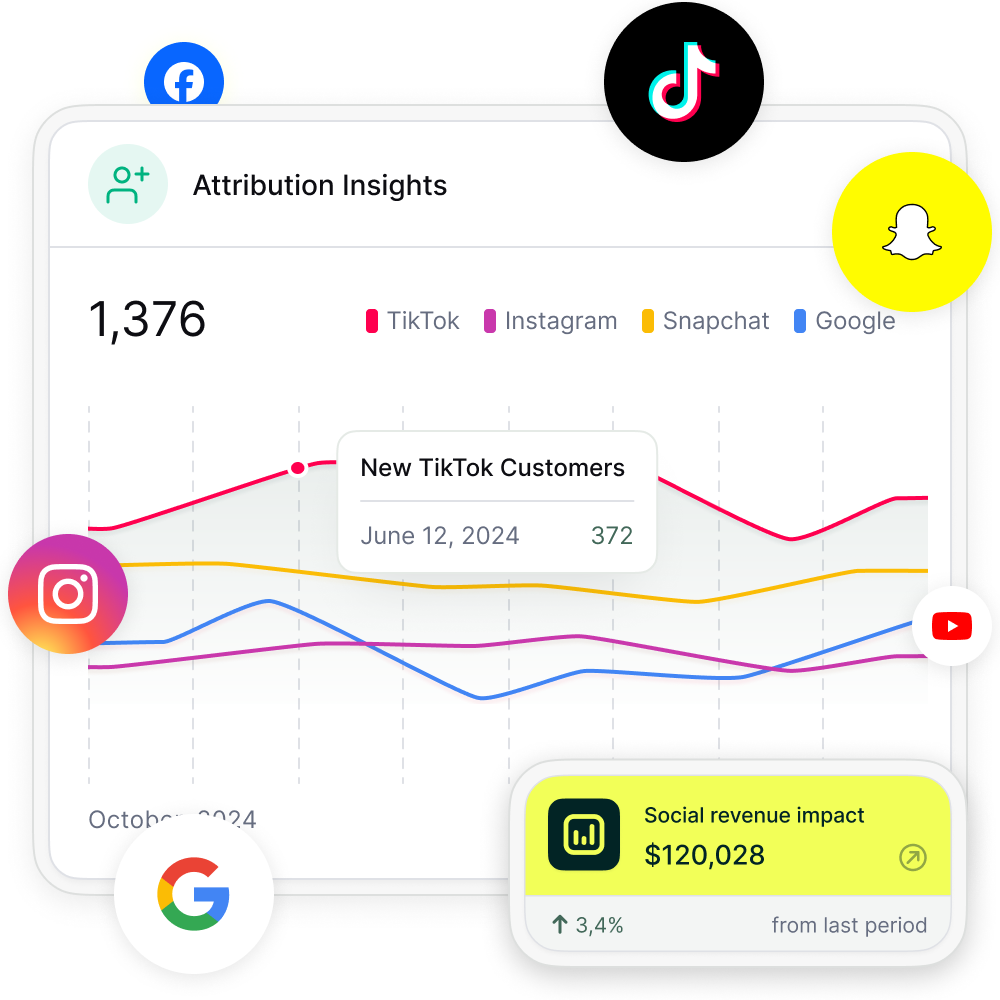
Madlitics captures detailed attribution data for every lead across channels like organic search, social media, referrals, and paid campaigns - even when prospects browse before converting. This level of granularity helps identify top-performing channels, refine marketing strategies, and allocate resources to areas that drive growth.
With the right attribution model and precise data, you can eliminate uncertainty and make informed, data-driven decisions across your marketing efforts.
Answers to your top questions about our platform