Support
Installing Madlitics in Framer
Add a custom code snippet to the <head> of your Framer site
Start capturing attribution →
Framer is known for its clean visual editor, responsive design tools, and creative flexibility — making it a favorite for designers and marketers who want full control without touching code. For teams that need precise attribution and analytics, Framer also makes it easy to add custom scripts — like Madlitics — directly into your site’s <head> tag.
In this guide, we’ll first cover creating your Madlitics account and grabbing your installation snippet. Then, we’ll walk through how to add that snippet into Framer and publish your changes so attribution runs across every page.
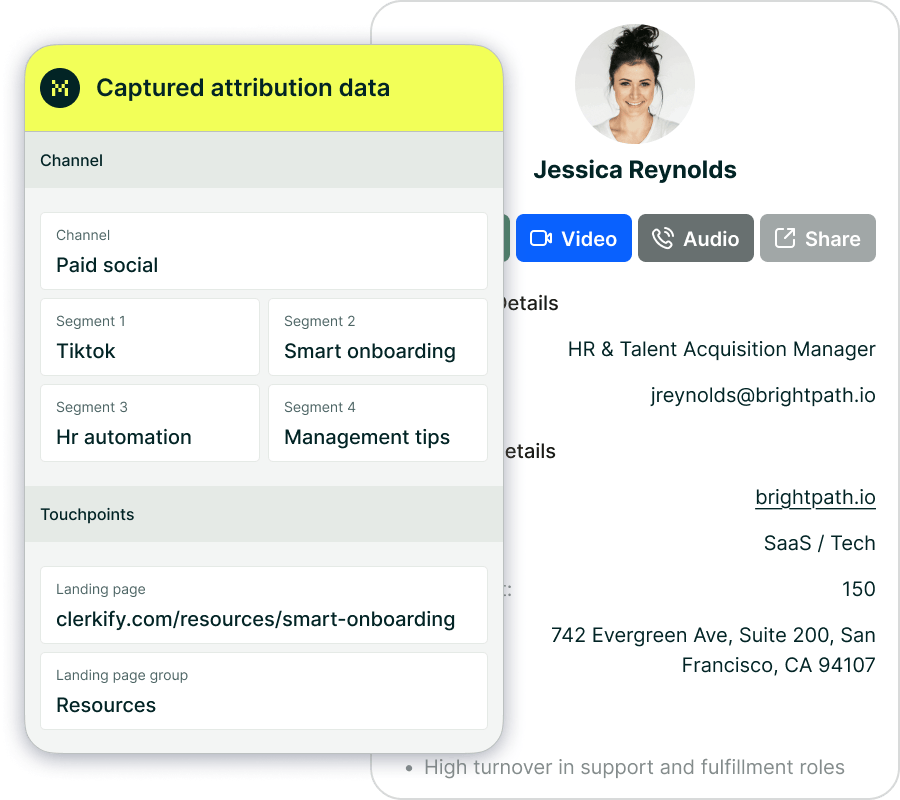
After Madlitics has been installed, next we'll update our forms with Madlitics fields to capture marketing data to and enhance customer submissions.
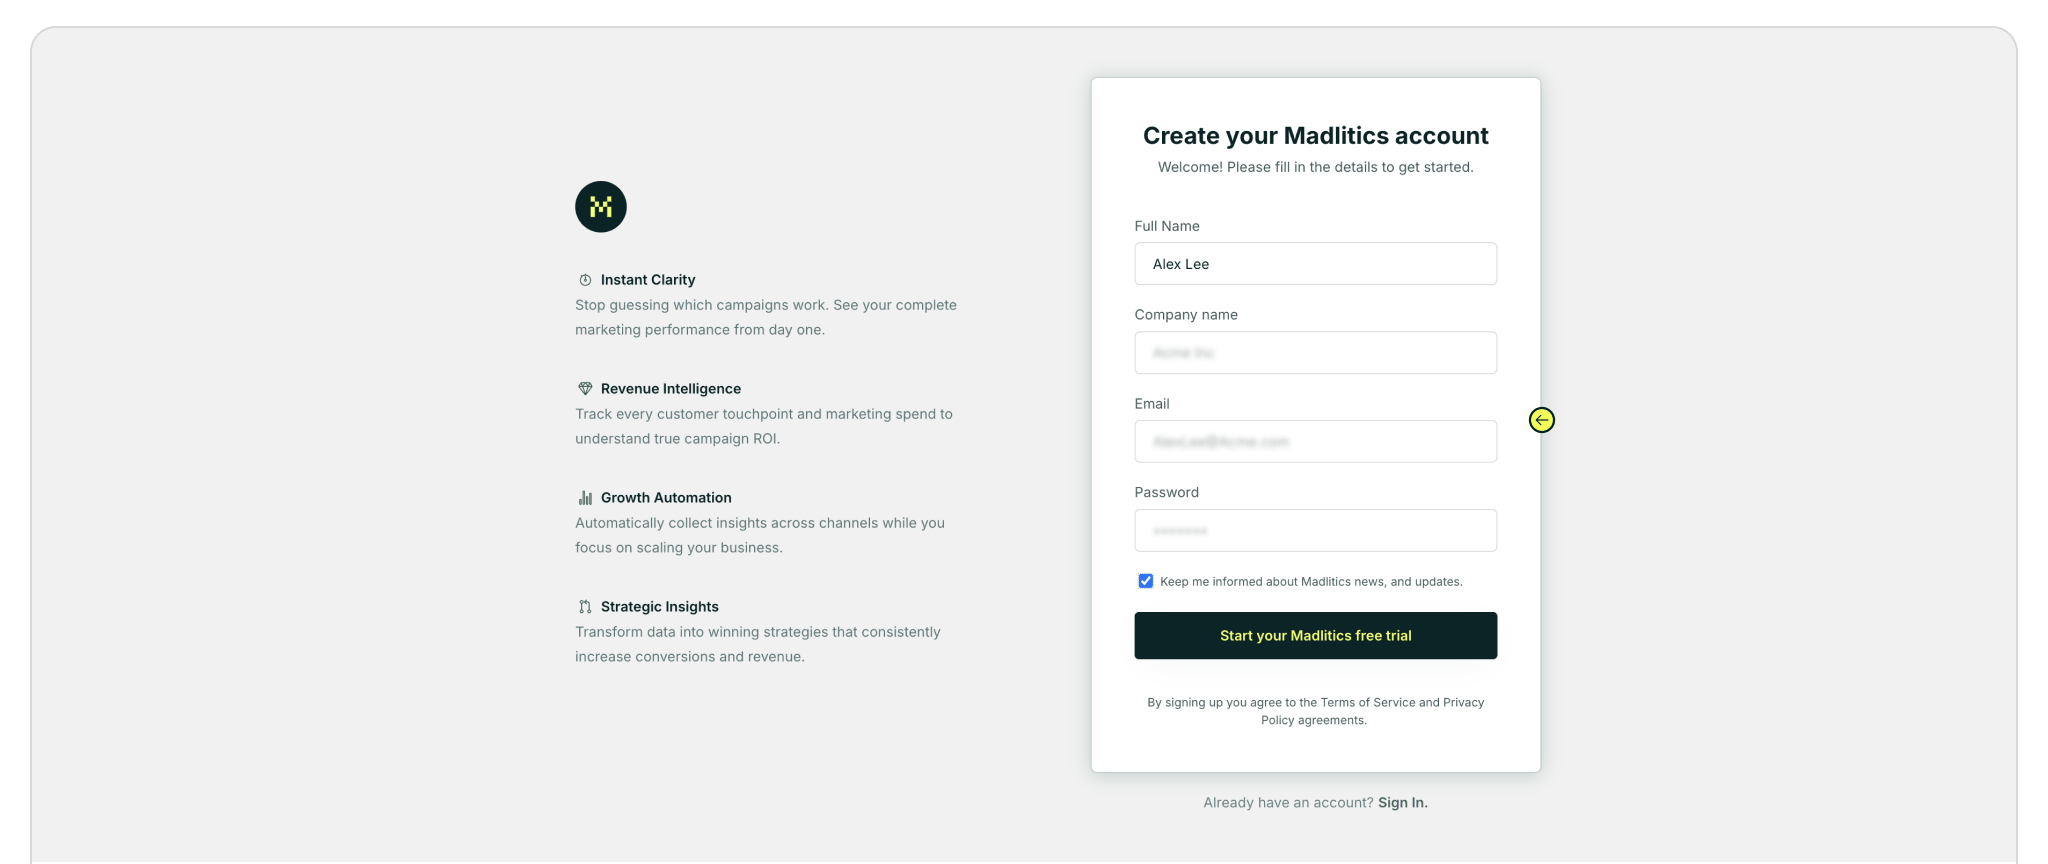
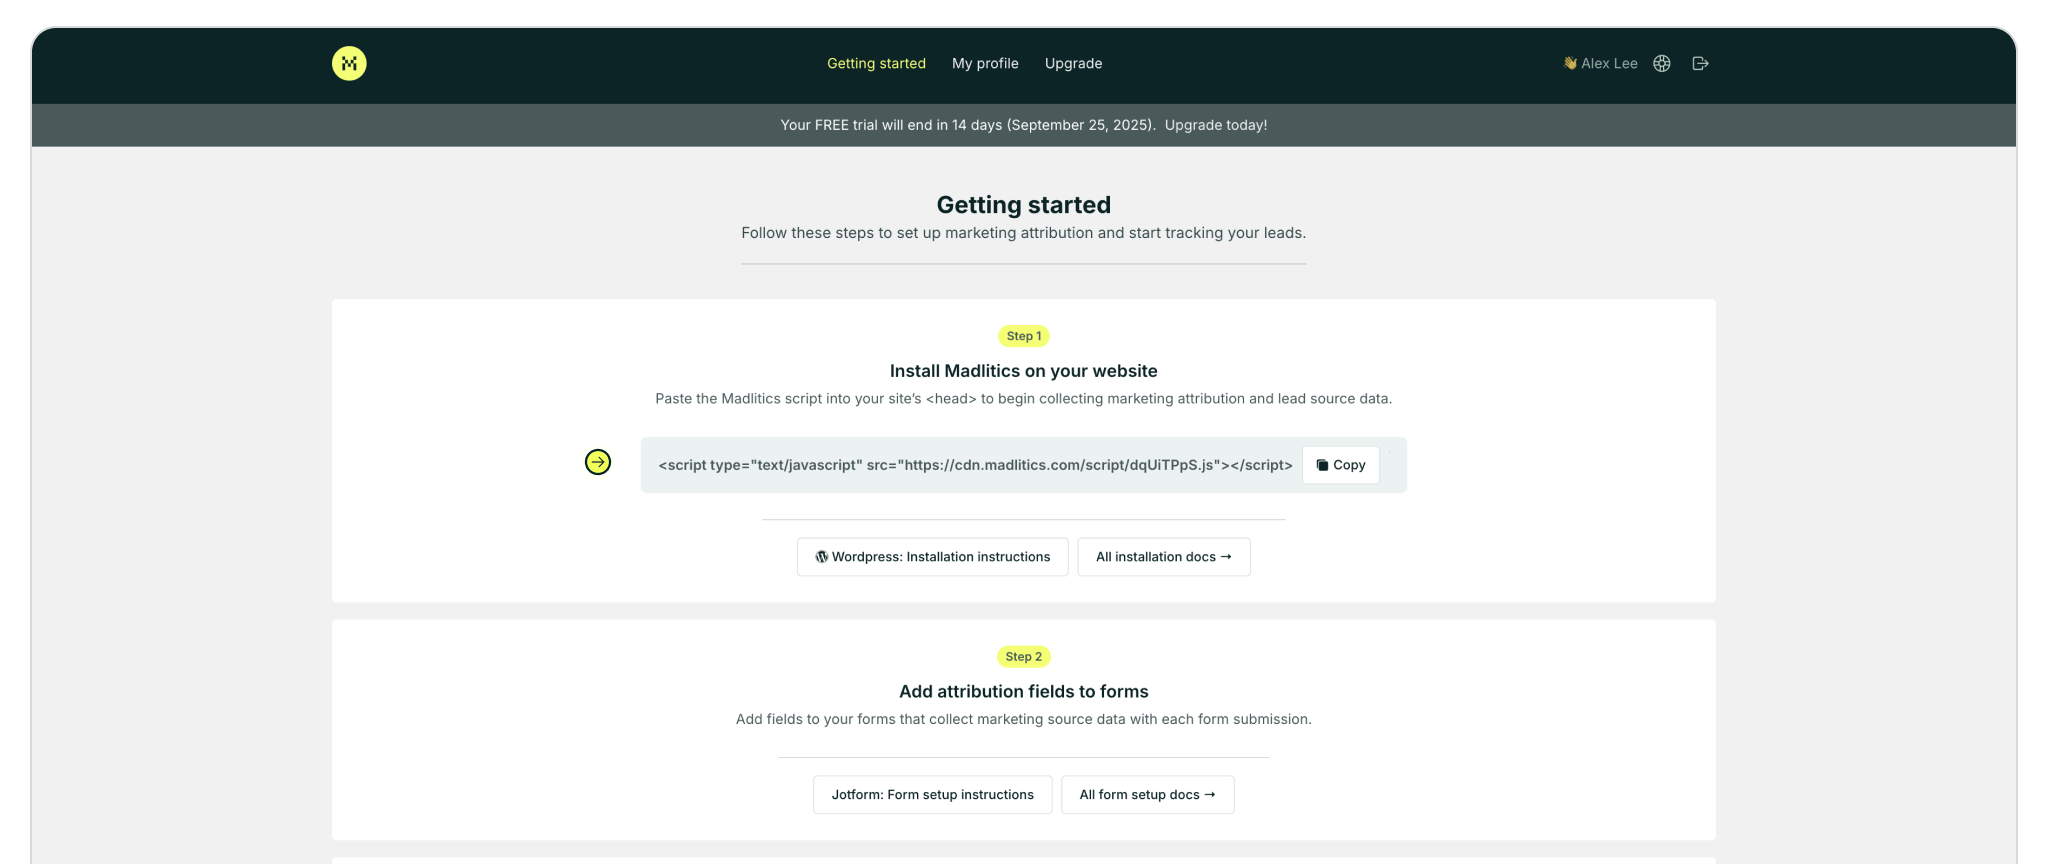
Sign up for a free trial on the Madlitics website to get started. Once you’ve registered and logged in, you’ll land in your dashboard’s Get Started section. Here, you’ll find your unique Madlitics installation snippet, which is required to enable tracking on your site.
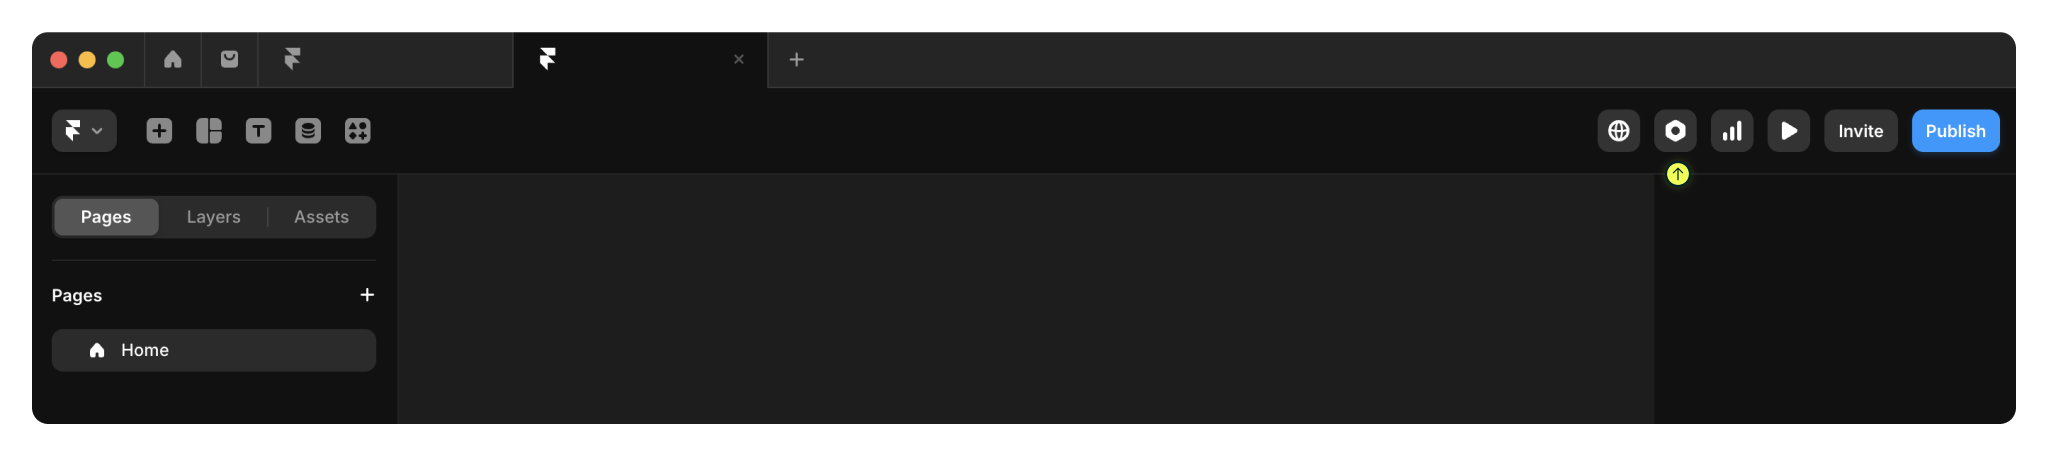
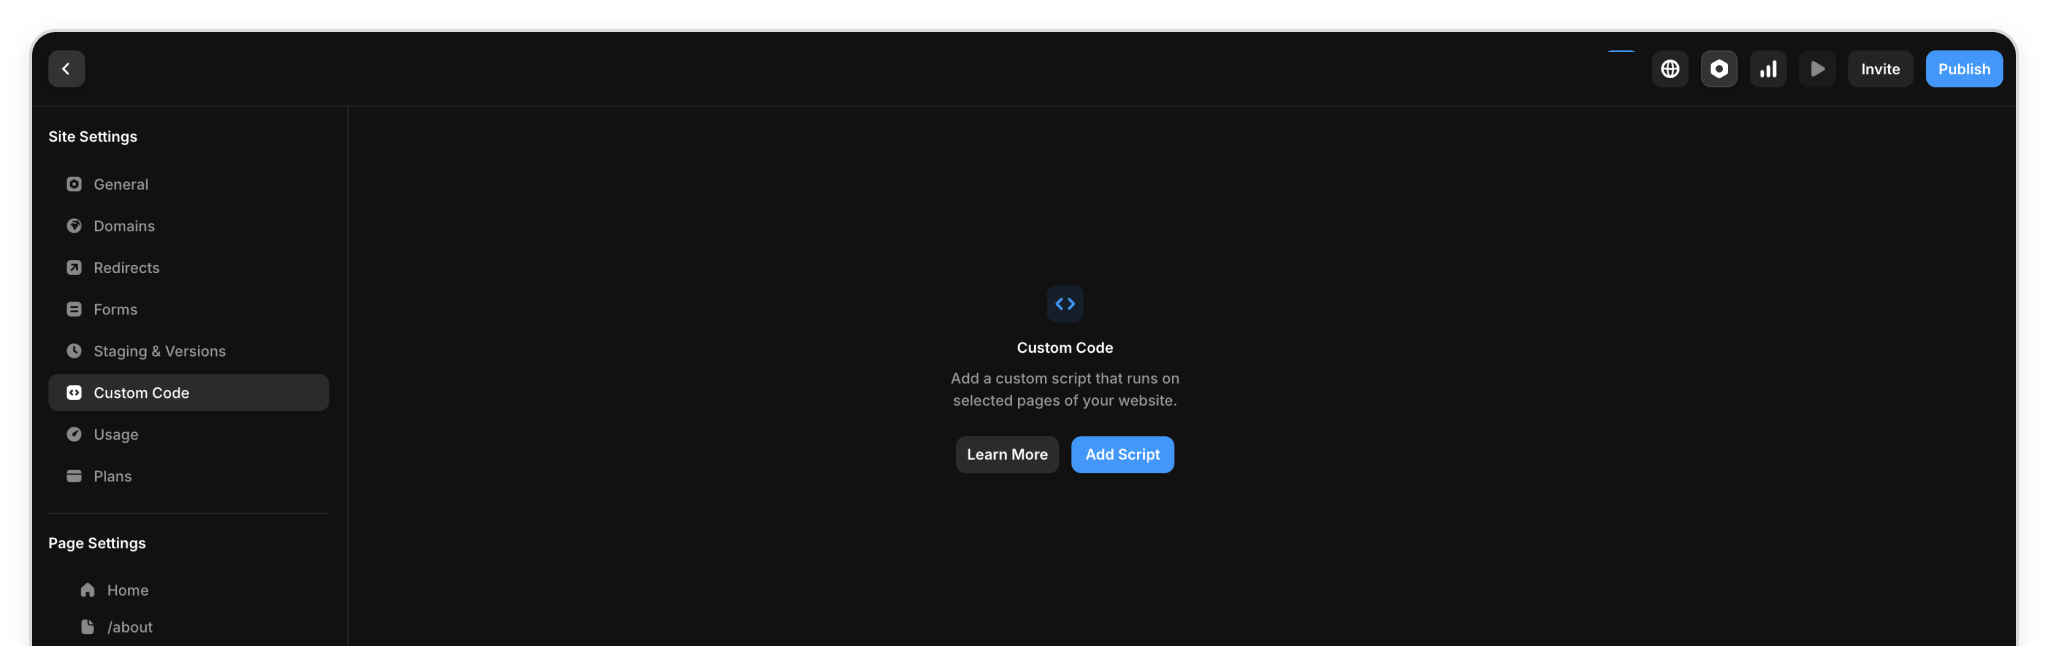
Inside Framer, adding your Madlitics snippet only takes a minute. Start by opening your site’s Settings from the dashboard or editor. In the left-hand menu, look for Custom Code — this is where you’ll manage any scripts that run on your site.
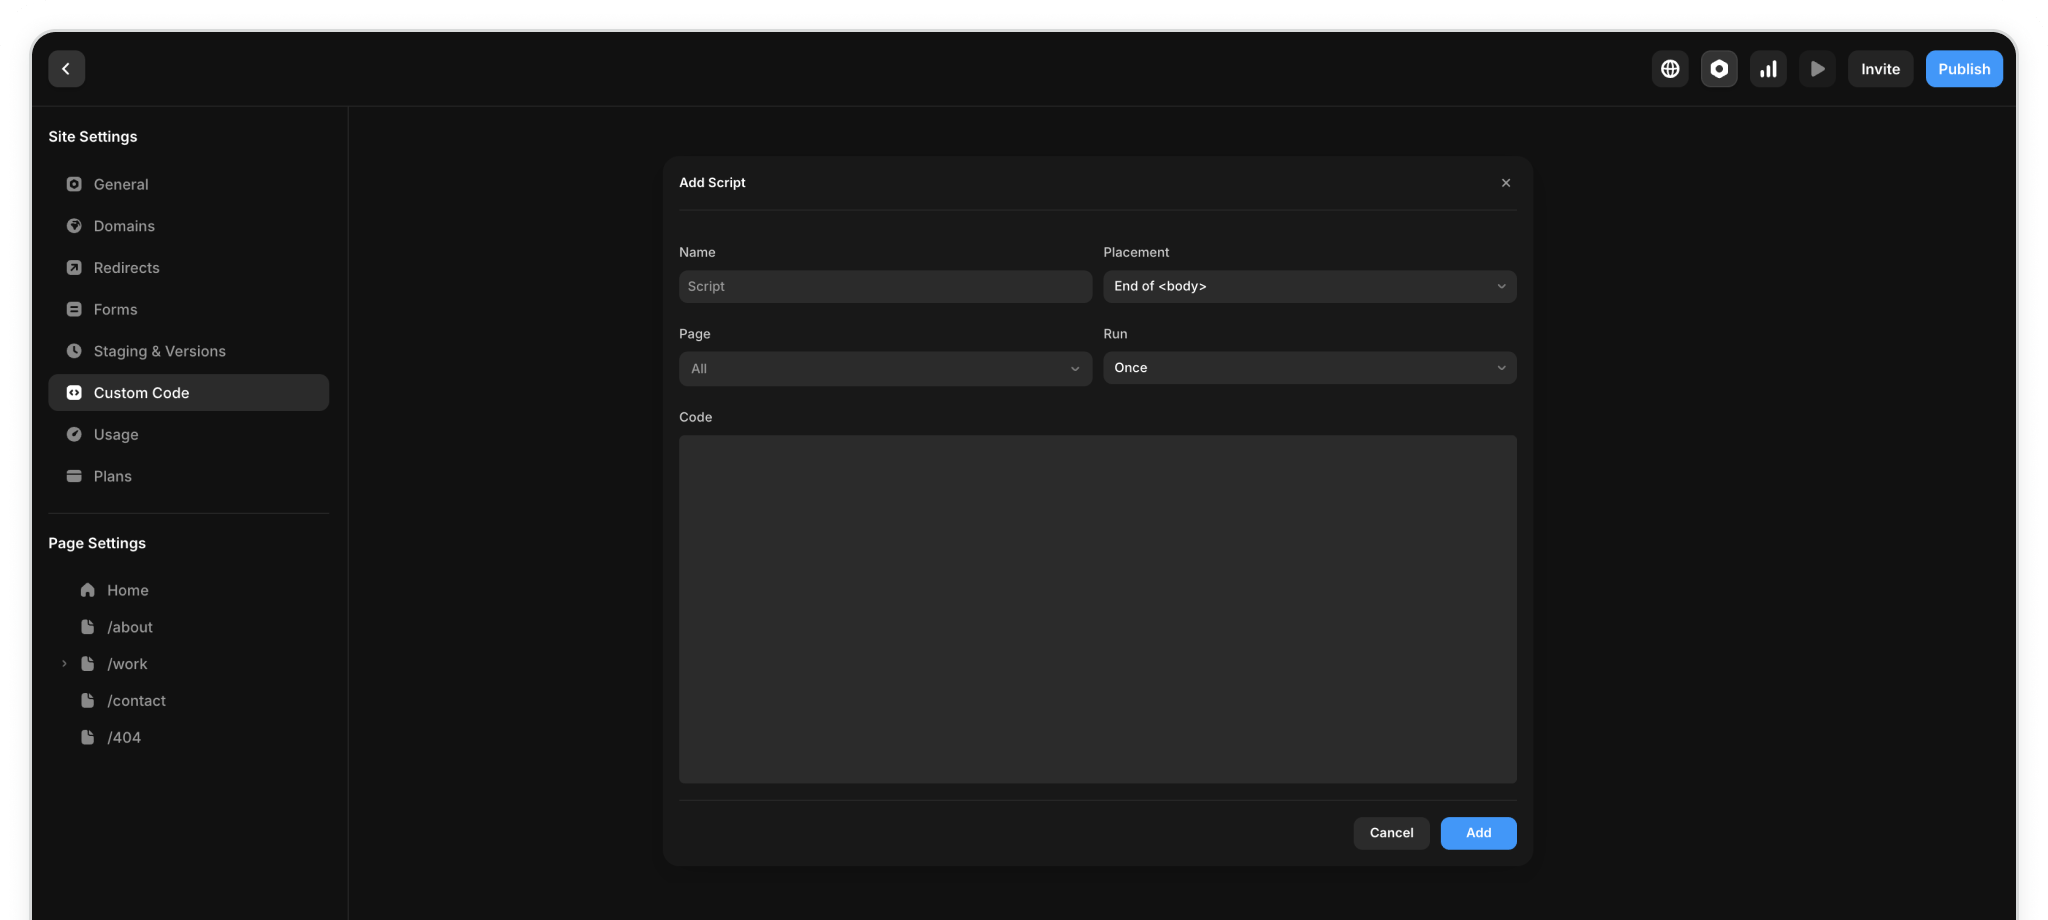
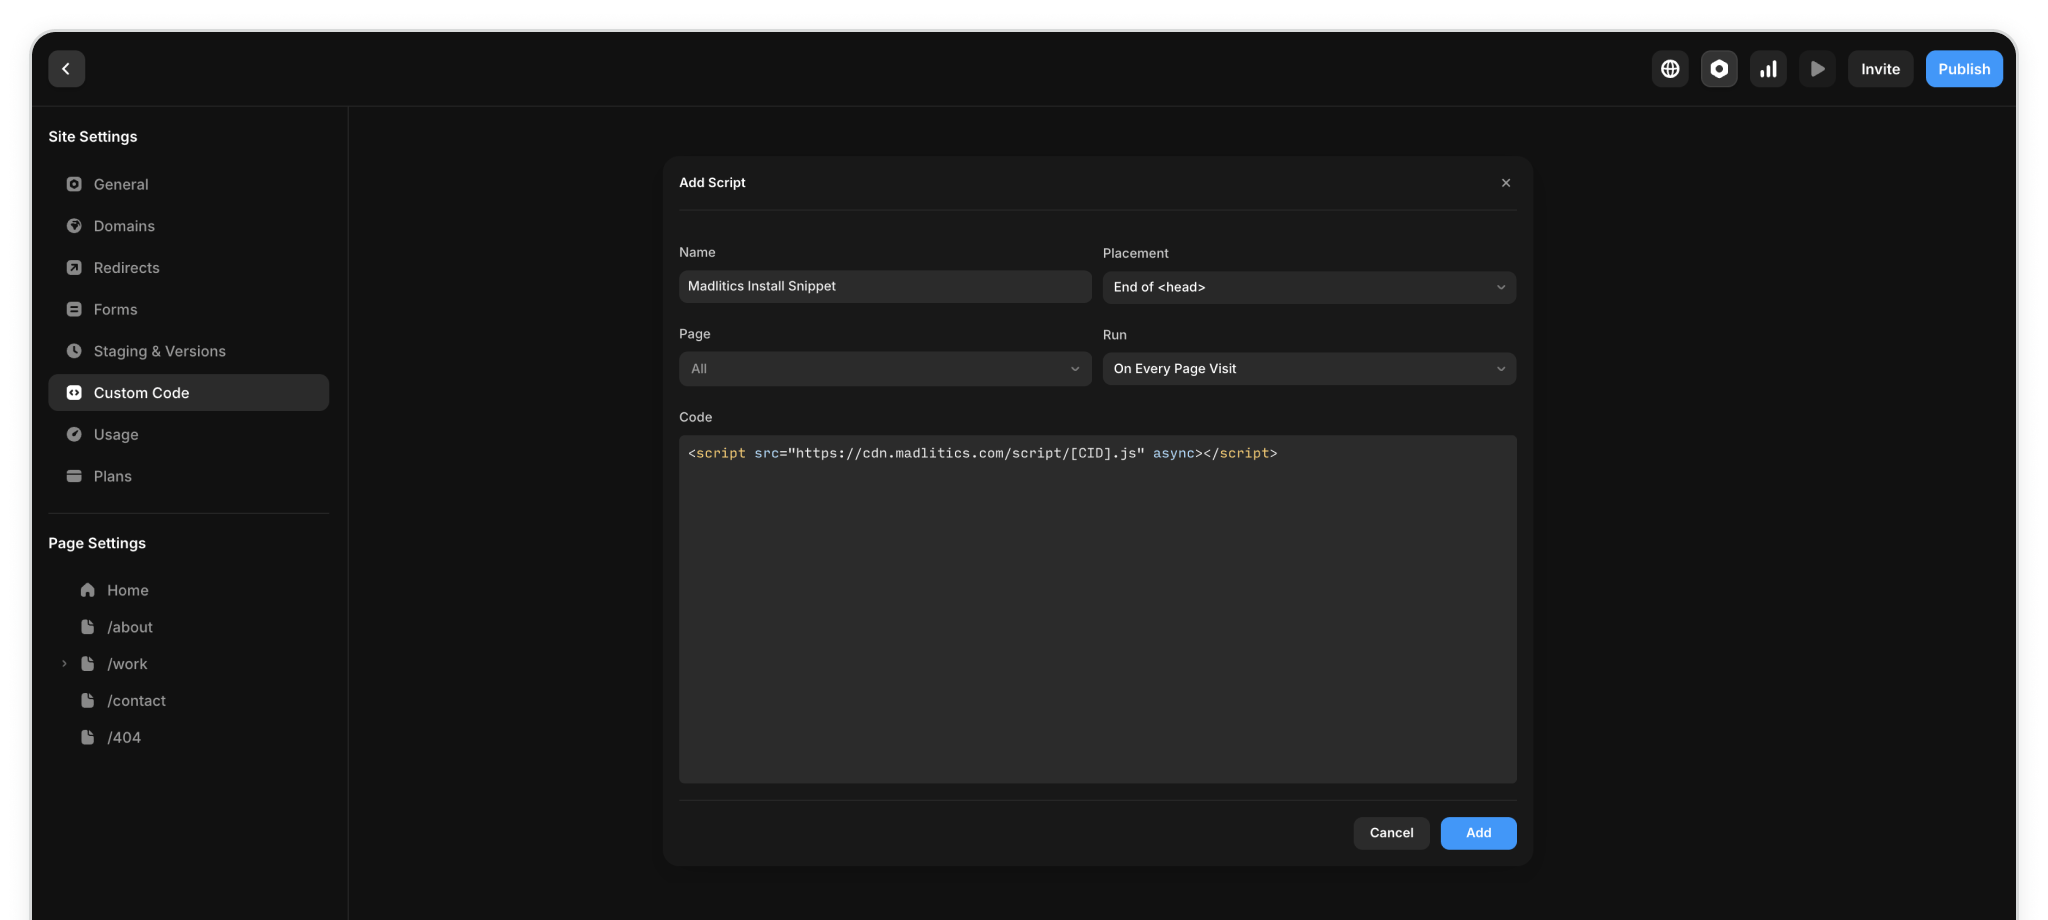
Click Add Script to create a new custom snippet. Give it a name so you can easily identify it later — something like “Madlitics tracking.” Set the placement to End of <head>, and make sure it’s set to run on All Pages and every page visit.
Next, paste your Madlitics code snippet into the code input area. Once you’re happy with it, click Add to save your snippet.
After saving, publish your site to push the changes live. Keep in mind that scripts don’t run in Framer’s preview mode, so you’ll need to check the published version to confirm that tracking is active.
“Madlitics Tracking”, and update the script options to Placement: End of <head>, and make sure it’s available on All Pages and Runs On every page visit.


To confirm everything’s working, open your published site in a browser. Right-click and choose Inspect, or press Cmd + Option + I (Mac) or Ctrl + Shift + I (Windows). In the Elements tab, scroll up to the <head> section and make sure your Madlitics snippet is there.
If you see it in place, you’re good to go!
• Configure Framer forms


Adding custom code to Framer is simple and powerful — giving you the flexibility to track, optimize, and personalize your site experience. With Madlitics installed, your marketing attribution data becomes visible, organized, and actionable.
Whether you're launching campaigns, syncing leads into your CRM, or reporting on ad performance, having the snippet installed ensures you never miss a source or lose track of a conversion. Publish your changes and let Madlitics do the rest.
Next step: Set up Framer forms to begin collecting marketing attribution and capturing UTM parameters.
Answers to common questions about Madlitics and Framer