Support

Enabling GCLID for attribution marketing

Configure your forms to capture Google's Click ID with Madlitics
Start capturing attribution →
Attribution is broken
Automation icon indicating hands-free marketing attribution and data flow.
Analytics report icon, indicating data insights and reporting.
Impact measurement icon, symbolizing marketing effectiveness.
Personalization icon, representing customization features.

GCLID (Google Click ID) is a unique identifier added to URLs when Google Ads’ autotagging is enabled. Unlike UTM parameters, this numeric string doesn’t provide human-readable campaign data — it’s designed for Google’s internal attribution models. While Madlitics doesn’t include GCLID in default fields, you can easily enable tracking for specialized use cases.

How to capture GCLID as a Madlitics field
Capturing GCLID data through Madlitics follows the same process you used when setting up your initial channel and segment fields. The configuration process varies slightly depending on your form platform of choice. If you need a refresher on setting up channel and segment fields, you can find general instructions in our form configuration guide.

Madlitics field values

GCLID:
Field label: gclid
Default value: [gclid]
Madlitics multi-channel attribution visualization, showing marketing platforms like TikTok, Instagram, Google, and Facebook. The graphic highlights how different sources contribute to high-performing marketing channels.
Screenshot of a form builder interface with a highlighted 'Hidden Input' field. Accompanied by text explaining how to install and set up Madlitics by adding hidden fields to capture marketing attribution data.
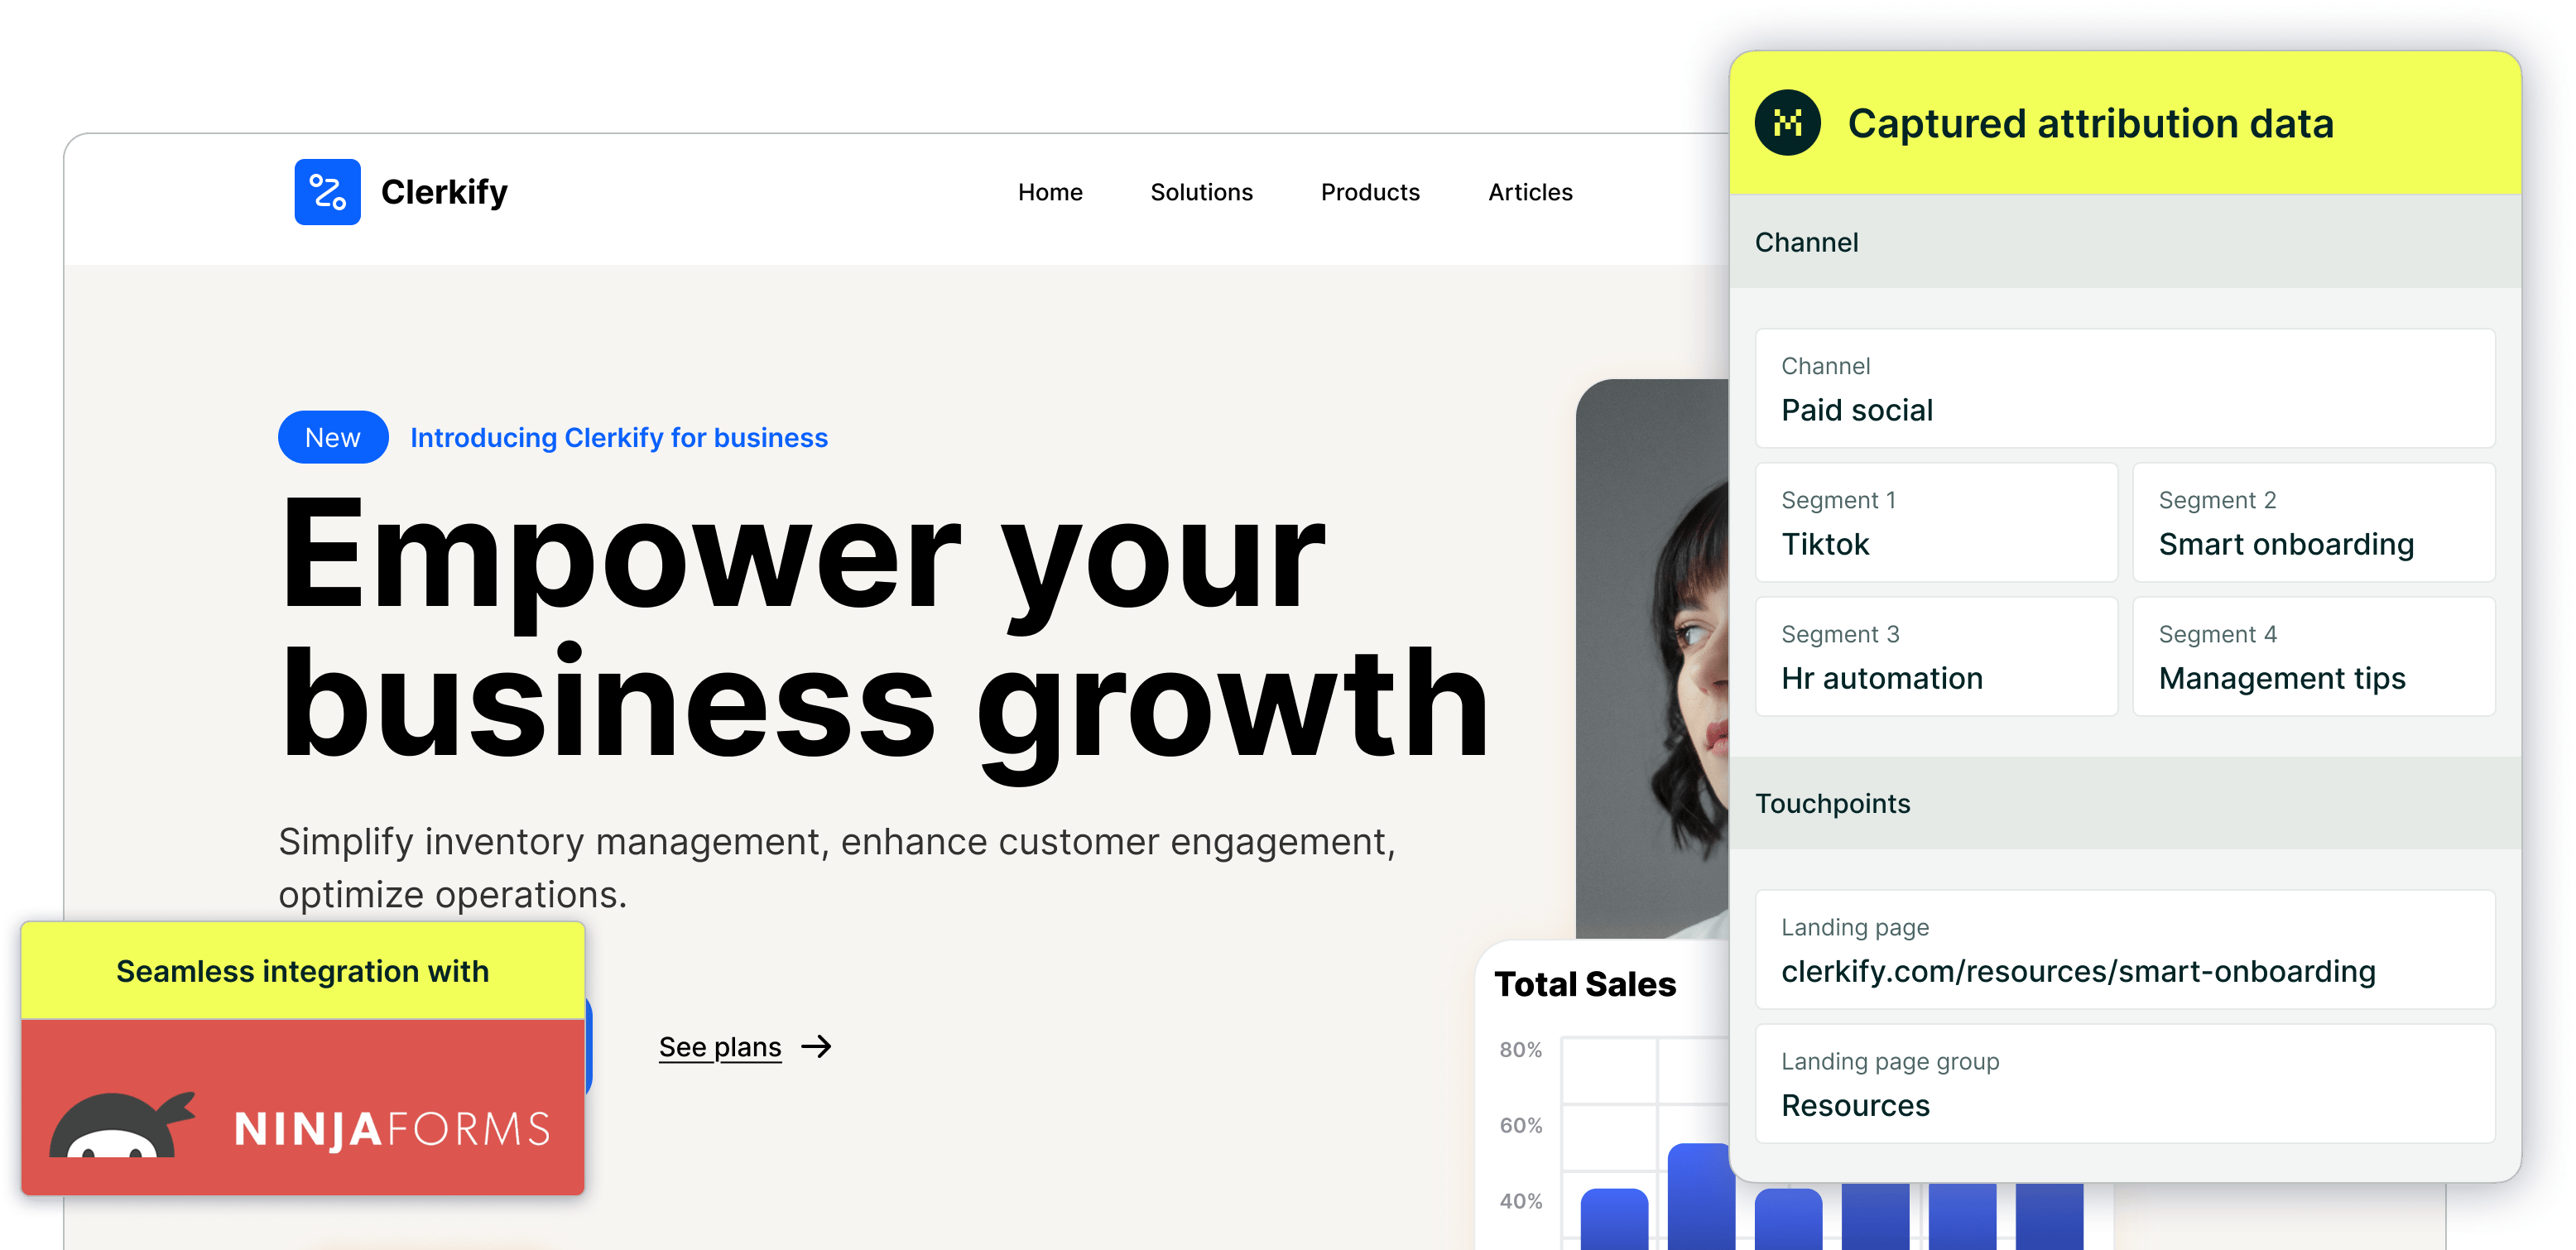
CRM interface showing a detailed view of captured attribution data, including marketing channels, segments, and landing pages. A business profile of a lead is displayed, highlighting how Madlitics enriches lead data for sales and marketing teams.
Graph showing new customer growth from TikTok, Instagram, Snapchat, and Google over time, with social media icons surrounding the chart and a callout for social revenue impact.
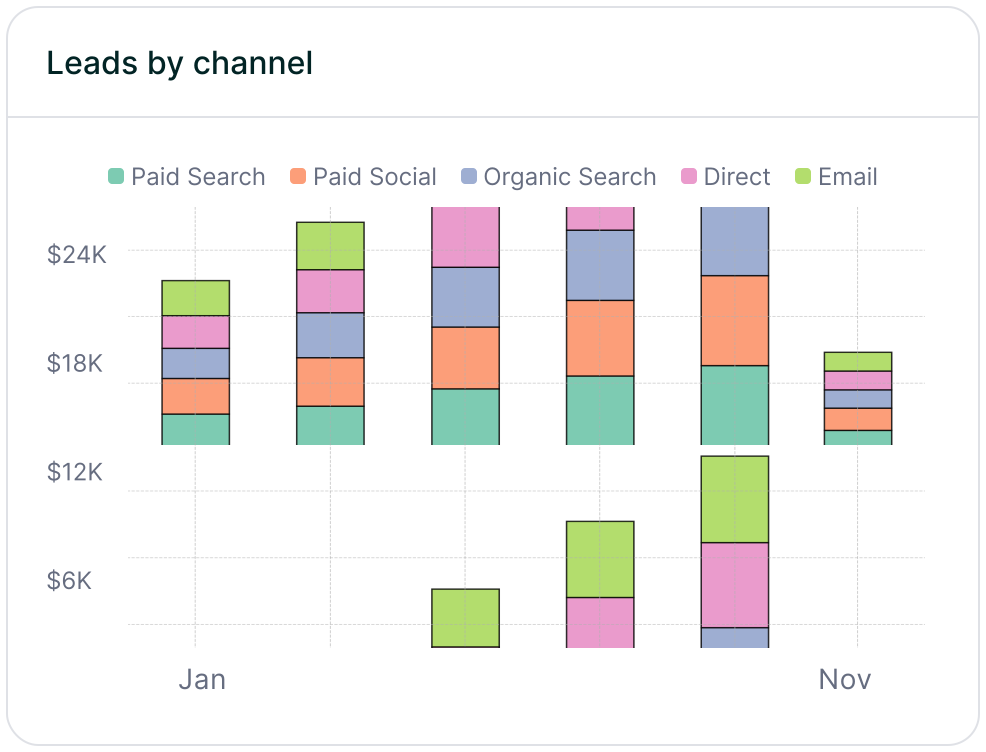
Stacked bar chart showing lead generation by marketing channel over time, comparing sources like Paid Search, Paid Social, Organic Search, Direct, and Email. Helps visualize which channels drive the most traffic.
Stacked bar chart illustrating lead volume across different marketing campaigns, including Black Friday, Retargeted, Spring Promo, Referral, and SEO. Highlights trends in campaign effectiveness.
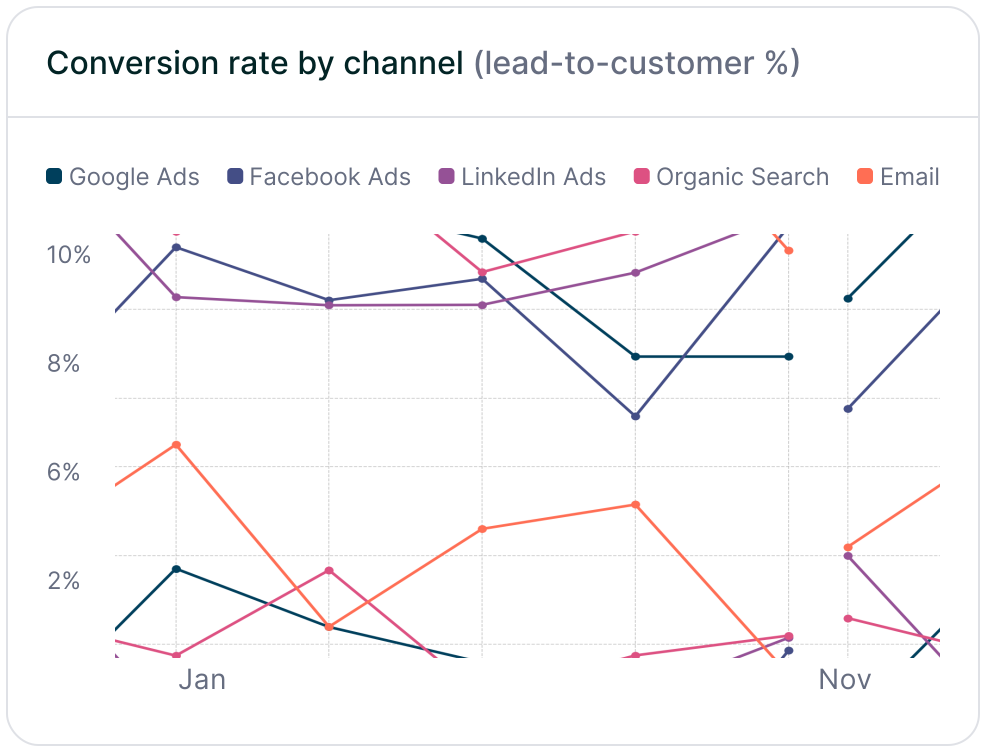
Line chart displaying lead-to-customer conversion rates by channel, comparing Google Ads, Facebook Ads, LinkedIn Ads, Organic Search, and Email. Shows how different sources drive qualified leads over time.
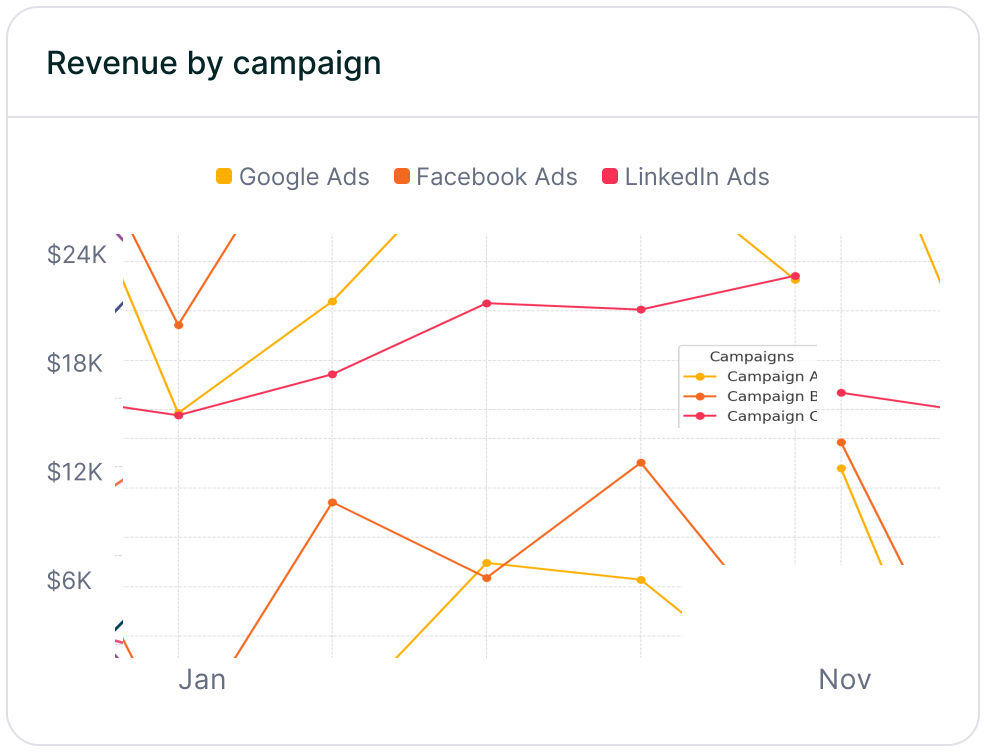
Line chart showing revenue performance by marketing campaign, comparing Google Ads, Facebook Ads, and LinkedIn Ads. Helps identify top-performing and underperforming campaigns.

Once enabled, GCLID data will flow into Madlitics reports alongside your attribution data.

GCLID tracking becomes relevant in specific scenarios — like troubleshooting discrepancies between Google Ads and Madlitics, meeting compliance mandates for click ID retention, or syncing data with custom tools requiring Google’s native identifiers. While most teams will never need it, we’ve made it simple to enable because Madlitics thrives on adaptability. Your success depends on having every tool you might need, even if you rarely use it—and we’re here to ensure you’re always prepared.

Related articles to get you started with Madlitics

Frequently asked questions

Answers to your top questions about our platform

Everything you need for reliable lead attribution
Accurate, persistent, and automated tracking — so your campaigns perform at their best.
Performance icon symbolizing marketing campaign effectiveness and results tracking.
Outperforms basic UTM tracking
Madlitics captures, categorizes, and persists attribution data across sessions, giving you a complete, structured view of what’s working in your marketing. Say goodbye to losing attribution when users navigate your site, struggling with formatting inconsistencies, and ingored non-UTM traffic.
Capture icon indicating data collection from various marketing channels and sources.
Capture all traffic
Madlitics categorizes all inbound leads — whether they have UTM parameters or not — so every conversion is accounted for, and you won't miss out on Organic Search, Organic Social, and Referral traffic.
Routing icon representing the flow of marketing data and attribution pathways.
Attribution across pages and sessions
A LinkedIn ad click should be attributed correctly—even if the visitor signs up on a different page later. If someone clicks an ad, browses multiple pages, then submits a form later, Madlitics persists attribution data across sessions, ensuring your reports reflect true performance.
List icon representing structured marketing data, reports, or campaign breakdowns.
Cleaner, more reliable data
Duplicate UTMs and inconsistent formatting break reports and mislead teams. Madlitics cleans and organizes attribution data before sending it to your CRM, giving you accurate insights.
Target icon symbolizing precise audience targeting and marketing campaign focus
See which content converts
Attribution isn’t just about where visitors came from—it’s about what convinced them to convert. By capturing landing page data alongside UTM parameters, Madlitics shows you which blog posts, case studies, or pricing pages drive the most revenue, helping you scale content that works.
Action icon representing campaign execution, optimization, and engagement.
Transform form submissions into actionable insights
Madlitics connects marketing touchpoints to lead generation, ensuring every form submission is fully attributed — optimize ad spend by identifying high-ROI channels, refine messaging based on what content drives engagement, make data-driven decisions with clean, structured reports, and more.