Support

Why keyword data is missing or "not provided"

Why keyword data can show as "(not provided)" and what to do

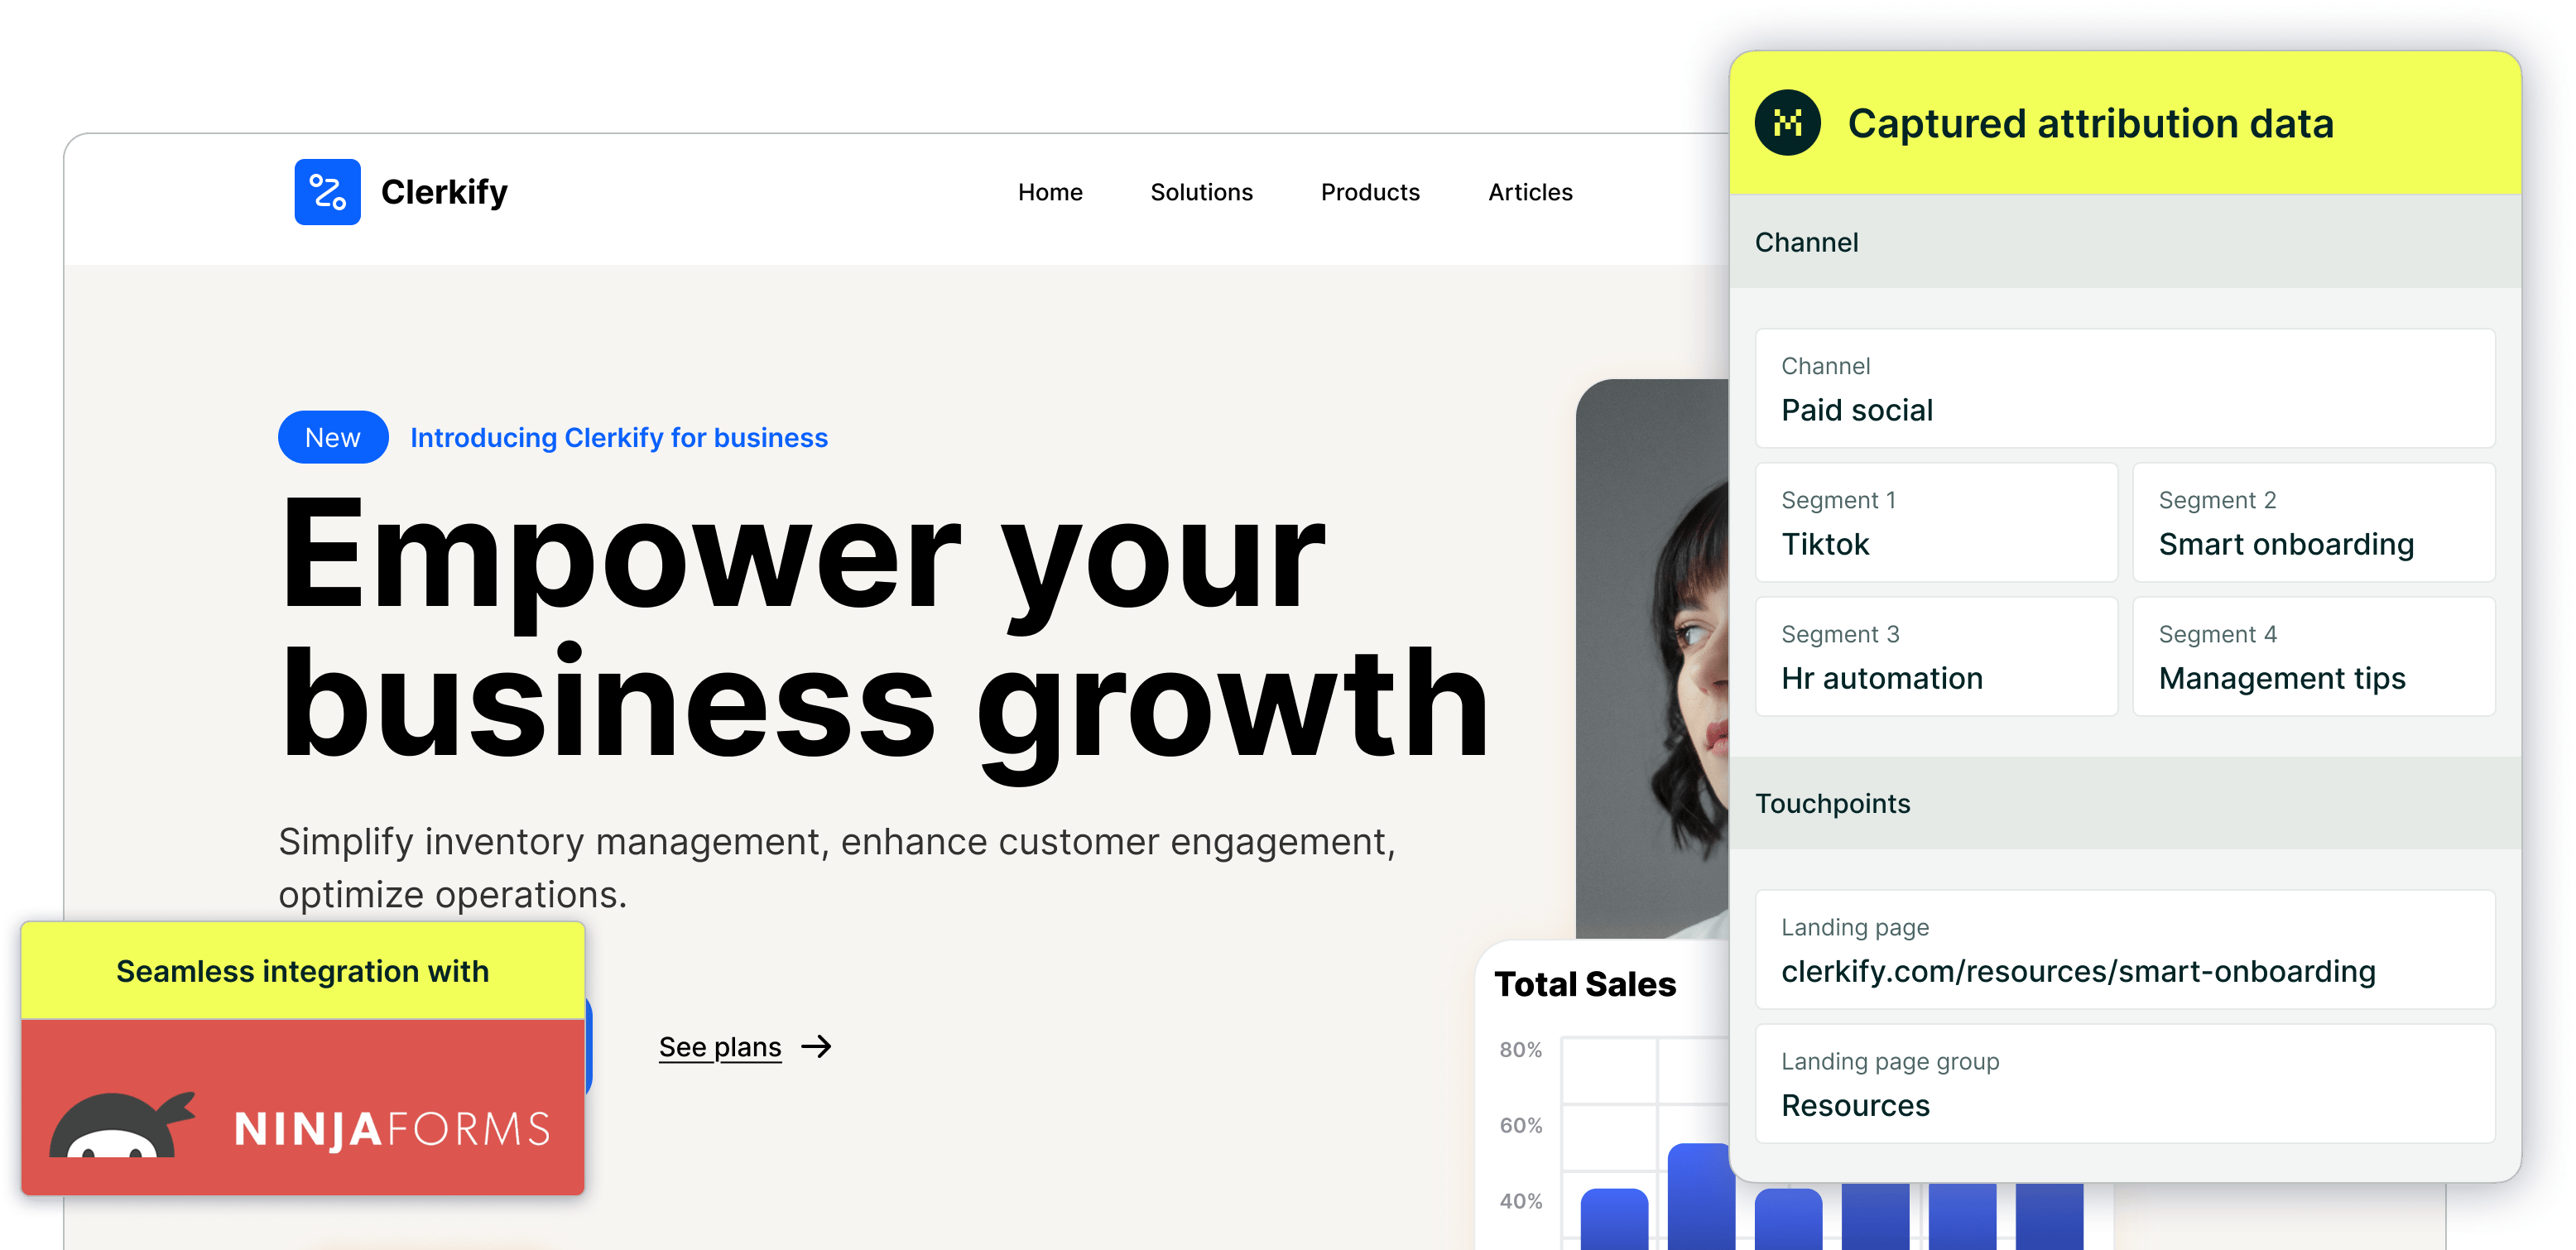
If you've noticed keyword data appearing as "(not provided)" in your analytics, you're not alone. This is a widespread issue that online businesses and website owners encounter — it’s not caused by a bug in your tools. Instead, it’s the result of deliberate changes made by Google to enhance user privacy.

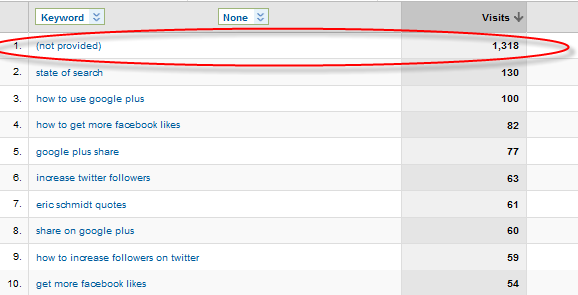
When users search on Google and land on your site, the specific keywords they used are often encrypted due to HTTPS secure search protocols. As a result, instead of showing the exact search terms, analytics tools—including Madlitics—receive "(not provided)" as the keyword.

Analytics example showing 'not provided' as the keyword for most visitors.

Why This Happens
Keyword data used to be readily available in analytics tools, offering website owners a clear window into the search terms driving traffic. However, as online privacy became a growing concern, Google made the decision to protect users’ search queries by encrypting them.

Here’s what’s going on:
1. Privacy First:
Google prioritizes the privacy of its users by encrypting search queries performed on secure (HTTPS) connections.
2. The "Not Provided" Keyword:
When search data is encrypted, websites are unable to capture the exact keywords used, so analytics tools—including Madlitics—display "(not provided)" instead.
3. A New Normal:
This shift means that businesses and marketers can no longer see a complete picture of which search terms brought visitors to their site, presenting challenges for SEO and campaign optimization.

How Keyword Data is Populated in Madlitics
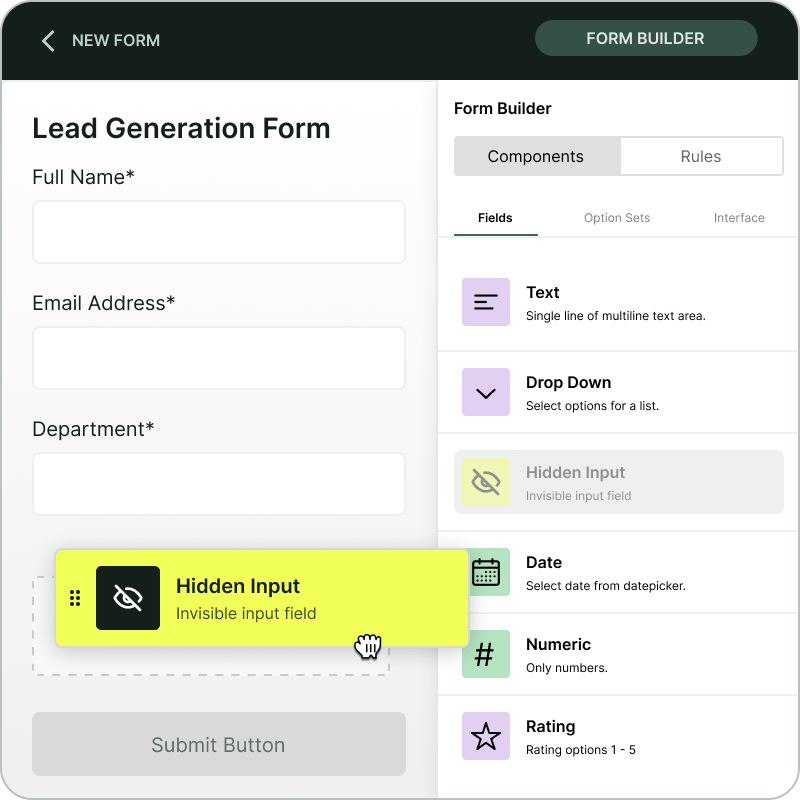
In Madlitics, keyword data is captured in the Madlitics field 'Segment3'. When search engines like Google pass keyword data (such as in non-encrypted searches), Madlitics collects and organizes it into this field. However, when keyword data isn’t passed through due to encryption, 'Segment3' will show "(not provided)." This reflects the broader industry trend and is not unique to Madlitics—it’s simply how modern analytics works.

What You Can Do
While this change may feel limiting, there are still ways to extract valuable insights and refine your SEO strategy:

• Use Google Keyword Planner: Tools like Google’s Keyword Planner are a goldmine for researching potential keywords. You can uncover search volumes and discover new terms to target, even if you can’t track every exact query in your analytics.
• Analyze Landing Pages:
Focus on the performance of your landing pages. By understanding which pages are attracting traffic and converting visitors, you can make educated assumptions about the search intent that’s driving those results.
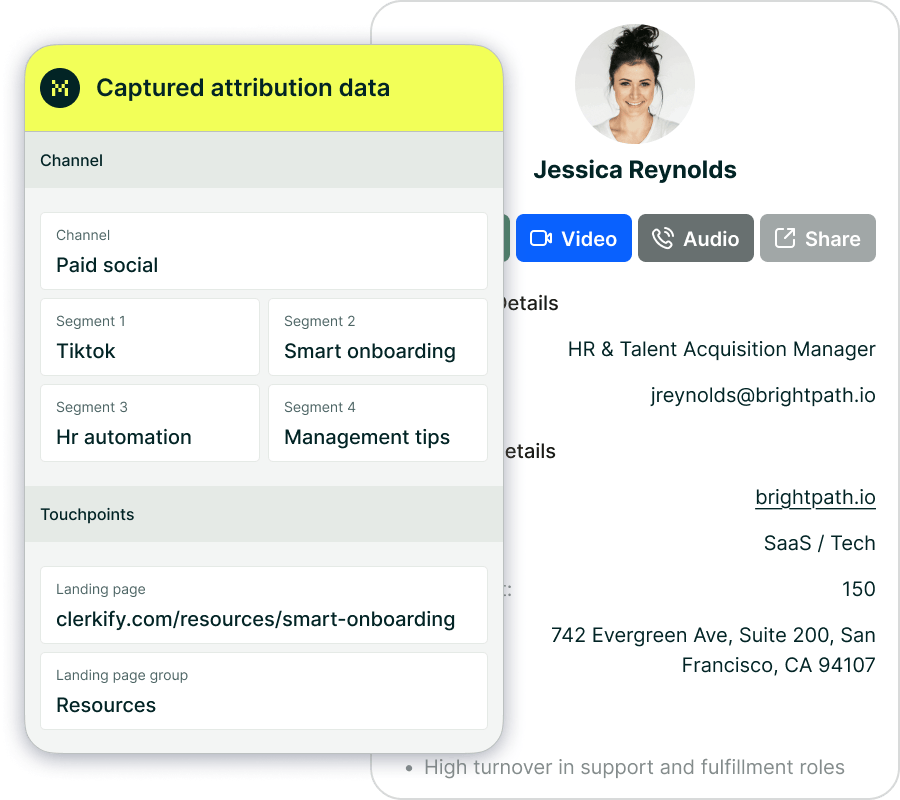
• Leverage Madlitics Insights:
Madlitics does more than just capture keyword data — it groups your traffic into clear marketing channels, providing a broader view of what’s driving results. Use this data to identify which channels, campaigns, and strategies are most effective at reaching your audience.

Keyword data issues are a challenge for everyone in digital marketing, but with tools like Madlitics and a strategic approach, you can still uncover valuable insights to optimize your campaigns.

Madlitics multi-channel attribution visualization, showing marketing platforms like TikTok, Instagram, Google, and Facebook. The graphic highlights how different sources contribute to high-performing marketing channels.
1. Add UTM parameters to all inbound links
Any marketing effort that drives traffic — whether it’s a paid ad, an email campaign, or an organic post — should have properly structured URLs that clearly define the visitor’s origin. Setting it up is a straightforward process that starts with ensuring all inbound links include UTM parameters.

A LinkedIn campaign, for example, might link to:
https://yoursite.com/?utm_source=linkedin&utm_medium=paidsocial&utm_campaign=q1_promo
Screenshot of a form builder interface with a highlighted 'Hidden Input' field. Accompanied by text explaining how to install and set up Madlitics by adding hidden fields to capture marketing attribution data.
2. Add hidden fields
Once you’ve added UTM tracking to your inbound links, the next step is to install Madlitics on your site and update your Framer Forms to include hidden fields that will store attribution data when a visitor submits a form automatically. Hidden fields to include:
• Channel (e.g., Paid Search, Organic Social, Direct)
• Segment 1 (Platform name: Google, LinkedIn, Twitter)
• Segment 2 (Campaign name)
• Segment 3 (Ad group, offer name, or post type)
• Segment 4 (Creative type or ad variation)
• Landing page/group (Tracking & first-touch attribution)
CRM interface showing a detailed view of captured attribution data, including marketing channels, segments, and landing pages. A business profile of a lead is displayed, highlighting how Madlitics enriches lead data for sales and marketing teams.
3. Utilize attribution data
With the setup complete, every form submission in Framer now carries full attribution data, ensuring accurate insights into where leads originate. Pass this data to your CRM, analytics tools, or marketing automation platforms to track performance, refine campaigns, and optimize marketing efforts with precision.

Turning a Challenge Into an Opportunity
While the lack of detailed keyword data presents new challenges, it also encourages marketers to think beyond individual search terms. Tools like Madlitics enable you to see the bigger picture by organizing your traffic into actionable insights. Instead of getting lost in granular data, you can focus on what truly matters: optimizing campaigns, improving your website, and driving meaningful results.

For a deeper dive into why keyword data is encrypted, check out Google’s official blog on secure search.

Put attribution data to work
Sync, analyze, and automate — turn insights into action.
Automation icon indicating hands-free marketing attribution and data flow.
Sync with your CRM
Pass UTM parameters into Salesforce, HubSpot, or ActiveCampaign so your sales team knows exactly where every lead came from — no more guessing.
Analytics report icon, indicating data insights and reporting.
Built smarter reports
Use Google Sheets, Looker Studio, or Airtable to create data-driven reports that reveal which campaigns drive real revenue — helping you make informed budget decisions.
Impact measurement icon, symbolizing marketing effectiveness.
Track revenue impact
Sync UTM data with Stripe, PayPal, or Chargebee to see which campaigns generate paying customers, not just leads — so you can scale what works.
Personalization icon, representing customization features.
Personalize email campaigns
Trigger personalized email flows in Klaviyo, Mailchimp, or ConvertKit based on a lead’s original source — ensuring the right message reaches the right audience.
Visualizing your marketing impact
See how attribution data translates into actionable insights.
Stacked bar chart showing lead generation by marketing channel over time, comparing sources like Paid Search, Paid Social, Organic Search, Direct, and Email. Helps visualize which channels drive the most traffic.
Leads by channel
See how different marketing channels contribute to lead generation over time. Understand which ones drive the most traffic and whether your marketing mix is balanced. Shift your budget toward the highest-performing channels to maximize results.
Stacked bar chart illustrating lead volume across different marketing campaigns, including Black Friday, Retargeted, Spring Promo, Referral, and SEO. Highlights trends in campaign effectiveness.
Leads by campaign
Track inbound leads across all campaigns, whether or not they have UTM parameters. Ensure every lead is categorized correctly, including Organic and Referral traffic. Use this insight to refine messaging, targeting, and budget allocation for better performance.
Line chart displaying lead-to-customer conversion rates by channel, comparing Google Ads, Facebook Ads, LinkedIn Ads, Organic Search, and Email. Shows how different sources drive qualified leads over time.
Conversion rate by channel
See which channels convert leads into paying customers. Some bring buyers, while others generate unqualified leads. Focus your budget on what drives revenue.
Line chart showing revenue performance by marketing campaign, comparing Google Ads, Facebook Ads, and LinkedIn Ads. Helps identify top-performing and underperforming campaigns.
Revenue by campaign
Focus your budget on campaigns that drive revenue, not just leads. Identify top performers and optimize underperforming efforts to maximize profitability.
Everything you need for reliable lead attribution
Accurate, persistent, and automated tracking — so your campaigns perform at their best.
Performance icon symbolizing marketing campaign effectiveness and results tracking.
Outperforms basic UTM tracking
Madlitics captures, categorizes, and persists attribution data across sessions, giving you a complete, structured view of what’s working in your marketing. Say goodbye to losing attribution when users navigate your site, struggling with formatting inconsistencies, and ingored non-UTM traffic.
Capture icon indicating data collection from various marketing channels and sources.
Capture all traffic
Madlitics categorizes all inbound leads — whether they have UTM parameters or not — so every conversion is accounted for, and you won't miss out on Organic Search, Organic Social, and Referral traffic.
Routing icon representing the flow of marketing data and attribution pathways.
Attribution across pages and sessions
A LinkedIn ad click should be attributed correctly—even if the visitor signs up on a different page later. If someone clicks an ad, browses multiple pages, then submits a form later, Madlitics persists attribution data across sessions, ensuring your reports reflect true performance.
List icon representing structured marketing data, reports, or campaign breakdowns.
Cleaner, more reliable data
Duplicate UTMs and inconsistent formatting break reports and mislead teams. Madlitics cleans and organizes attribution data before sending it to your CRM, giving you accurate insights.
Target icon symbolizing precise audience targeting and marketing campaign focus
See which content converts
Attribution isn’t just about where visitors came from—it’s about what convinced them to convert. By capturing landing page data alongside UTM parameters, Madlitics shows you which blog posts, case studies, or pricing pages drive the most revenue, helping you scale content that works.
Action icon representing campaign execution, optimization, and engagement.
Transform form submissions into actionable insights
Madlitics connects marketing touchpoints to lead generation, ensuring every form submission is fully attributed — optimize ad spend by identifying high-ROI channels, refine messaging based on what content drives engagement, make data-driven decisions with clean, structured reports, and more.