Campaign Performance Tracking: Complete Guide


Campaign performance tracking connects your marketing spend directly to revenue. It helps you understand not just what happened in your campaigns (like clicks or impressions) but why it happened and how it impacts your business goals. This approach is essential for refining marketing strategies, improving ROI, and aligning efforts with revenue growth.
To succeed, prioritize first-party data strategies, especially with the decline of third-party cookies, and focus on tracking systems that provide clear insights into which campaigns drive revenue. This guide outlines how to measure, analyze, and optimize campaign performance effectively.

When it comes to measuring campaign success, Return on Investment (ROI) takes center stage. This metric evaluates the percentage of profit generated from your investment using the formula: (Revenue - Investment Cost) ÷ Investment Cost × 100. It’s the go-to metric for presenting results to stakeholders and shaping high-level strategies.
Another critical metric is Cost Per Acquisition (CPA), which tracks how much it costs to secure a new customer or lead. CPA provides a better picture of efficiency compared to metrics like Cost Per Click because it directly ties spending to conversions. To get the full picture, pair CPA with Customer Lifetime Value (CLV) - the total profit a customer brings over their relationship with your brand. For a healthy balance, aim for a 3:1 ratio between CLV and CPA..
Conversion Rate is another essential KPI, measuring the percentage of visitors who complete a desired action, such as making a purchase, signing up, or downloading content. Average rates vary: e-commerce sites often see 1–3%, while B2B lead generation tends to hit 2–5%. Meanwhile, Return on Ad Spend (ROAS) focuses on the revenue generated for every dollar spent on advertising. Unlike ROI, which accounts for all costs, ROAS zeroes in on the efficiency of your ad spend, making it a key metric for day-to-day campaign adjustments.
Here’s a striking statistic: 73% of marketers struggle to link their metrics to actual business outcomes. The solution? Focus on actionable metrics like CPA, CLV, and ROAS. These metrics directly inform decisions, unlike vanity metrics - such as likes or impressions - that may look impressive but don’t drive meaningful strategy.
By understanding these KPIs, you can separate overall platform health from the performance of individual campaigns. This clarity is vital for making informed decisions at both the tactical and strategic levels.
Metrics can be divided into two categories: channel-level metrics and campaign-level metrics.
Here’s how these metrics compare across different channels and campaigns:
The distinction between these two types of metrics is crucial. Channel-level metrics reveal where to focus for sustainable growth, while campaign-level metrics pinpoint immediate actions to improve performance. Before launching a campaign, clearly define your primary KPIs. Decide whether your goal is to attract profitable customers or drive raw conversions. This ensures that your tracking systems are aligned with what matters most to your business and enables precise adjustments to enhance results.
Imagine a customer's journey: they see a Facebook ad, read a blog post, click on an email, and finally convert through a search engine. Attribution models determine how credit is assigned across that journey — whether to the very first interaction that introduced the customer to your brand, the last interaction before they converted, or some combination in between.
On average, consumers engage with a brand about eight times before making a purchase. Yet many businesses still rely on single-touch models, which either credit the first touchpoint that sparked awareness or the last touchpoint that closed the deal. Each approach tells a different story about what's driving your growth.
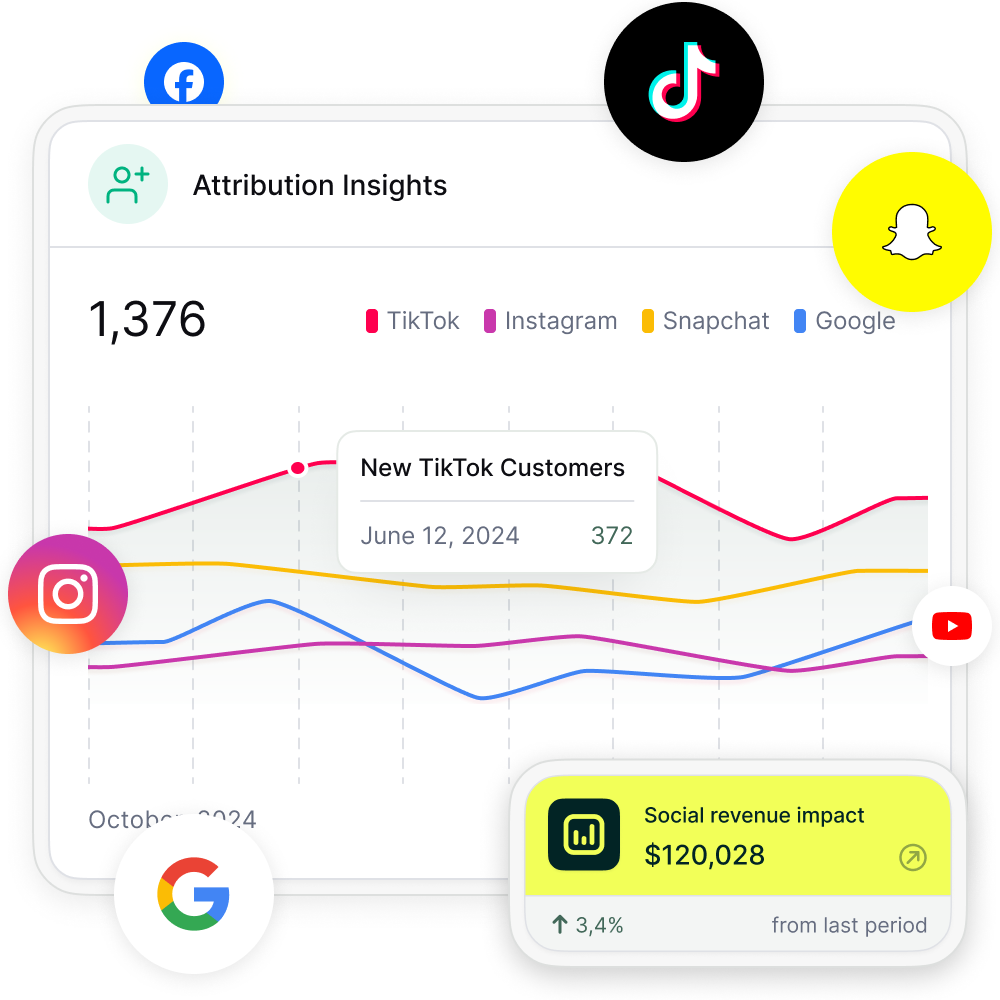
Tracking these interactions involves three main methods: JavaScript snippets on web pages to record activity, UTM parameters in URLs to identify sources, and APIs to pull data from CRMs and ad platforms. Once collected, the data is processed and credit is assigned according to your chosen model. With the right attribution in place, you can boost marketing performance by 15%–30%.
"Half the money I spend on advertising is wasted; the trouble is I don't know which half." – John Wanamaker
The key lies in selecting the right model for your business and ensuring accurate data collection from the start.
Different models assign credit to touchpoints in distinct ways:
First-Touch Attribution: Gives 100% of the credit to the very first interaction a customer had with your brand. This is useful for understanding which channels are best at building awareness and bringing new prospects into your funnel.
Last-Touch Attribution: Gives 100% of the credit to the final interaction before conversion. This is the most widely used model and works well for short sales cycles where the closing touchpoint is the most meaningful signal.
Linear Attribution: Distributes credit equally across all touchpoints. For example, if a customer interacts five times before converting, each touchpoint gets 20% of the credit. This is ideal for lengthy sales cycles where every interaction matters.
Time Decay Attribution: Gives more weight to touchpoints closer to the conversion. This is useful for short sales cycles or time-sensitive campaigns, where recent actions often have the greatest impact.
U-Shaped (Position-Based) Attribution: Assigns 40% of the credit to the first and last touchpoints, with the remaining 20% spread across middle interactions. This model balances the importance of building awareness and closing the sale.
W-Shaped Attribution: Designed for complex B2B sales, this model allocates 30% credit to the first touch, 30% to a key mid-funnel event (like filling out a form), and 30% to the final touch before conversion. It highlights critical moments in the buyer's journey.
Data-Driven Attribution: Relies on machine learning to analyze past performance and assign credit based on each touchpoint's actual influence. Google Ads adopted this as its default model in July 2023, though it requires at least 600 conversions in the last 30 days to function reliably.
Here's how to implement attribution effectively:
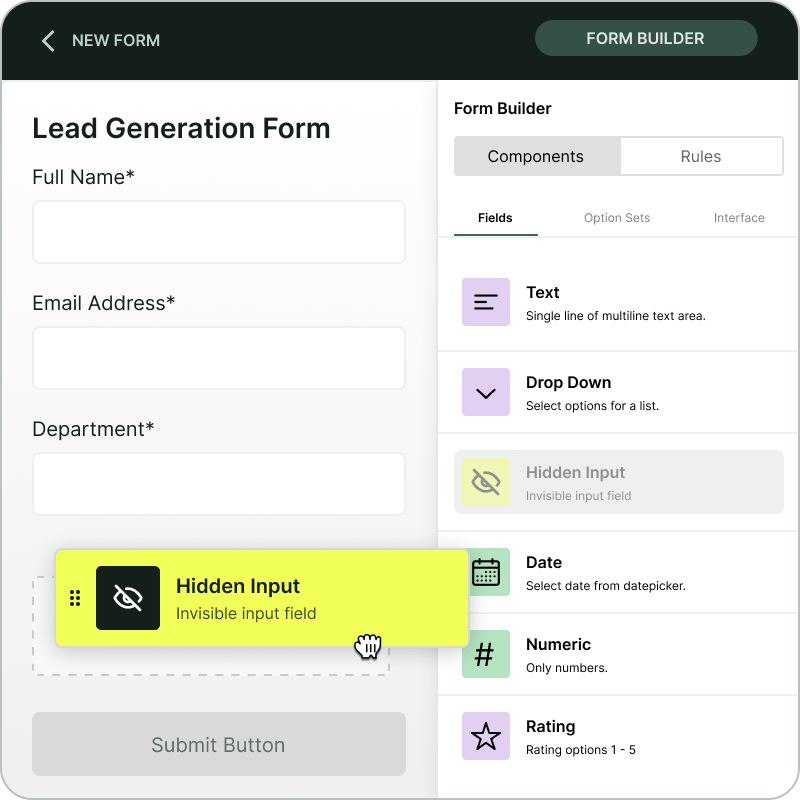
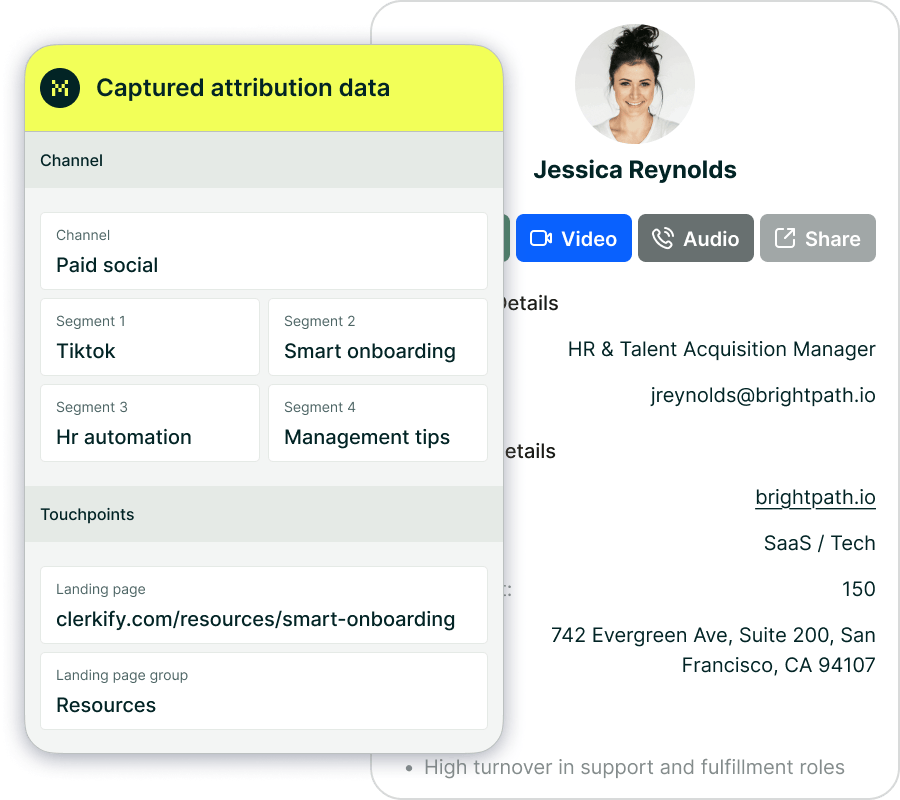
Collect Data: Use JavaScript tracking on your web pages to record user actions, apply consistent UTM parameters to all campaign URLs, and integrate data from ad platforms and your CRM. Even small errors in tagging can obscure valuable insights.
Centralize Your Data: Combine data from various sources — Google Ads, Facebook, email platforms, your CRM — into a single place. Unified data is essential for accurate attribution, especially since 59.4% of marketers cite aligning sales and marketing teams as a top goal.
Organize and Clean Your Data: Standardize campaign names, remove duplicates, and connect user sessions across devices where possible. Inconsistent naming conventions (e.g., "Spring_Sale" vs. "spring-sale") are one of the most common sources of attribution errors.
Choose the Right Attribution Model: Pick a model that reflects your sales cycle and business goals. First-touch is valuable when you want to understand what's driving new audience growth. Last-touch is more actionable when your focus is on closing conversions efficiently. The most important thing is that your model is applied consistently so comparisons over time remain meaningful.
Validate and Refine: Periodically review whether your attributed channels are actually driving revenue. Update your approach every 3–6 months to reflect shifts in customer behavior and your broader marketing mix.

Once you've chosen an attribution model, the next step is setting up a tracking system to collect essential data. Madlitics makes this process straightforward by automatically organizing traffic sources, maintaining attribution across sessions, and enriching form submissions with marketing details - so you don’t have to do it manually.
To get started, you’ll need to install the tracking code and configure your forms. First, add the Madlitics code snippet to your website’s header. This snippet begins tracking visitor behavior immediately, capturing channel and campaign data as soon as someone lands on your site. Then, update your forms by adding seven hidden fields to auto-populate attribution details. These fields include:
channel: Defines the traffic source, like Paid Social or Organic Search.segment1 to segment4: Captures platform, campaign name, keywords, and audience specifics.lp: Tracks the exact landing page URL.lpg: Identifies the landing page category.When users fill out forms - whether it’s a contact form, demo request, or newsletter signup - these fields are automatically filled with complete marketing context.
Madlitics works seamlessly with popular form builders like Contact Form 7, Elementor, Gravity Forms, Typeform, and WPForms. It also integrates with CRMs (e.g., Salesforce, HubSpot, ActiveCampaign) and marketing tools like Klaviyo and Mailchimp. To confirm everything’s working, submit a test form and ensure your CRM reflects the attribution fields, such as "Paid Search."
Persistent attribution takes your tracking a step further by ensuring data continuity across sessions. Traditional UTM tracking often loses campaign data if a visitor navigates away or returns later. Madlitics solves this by keeping the original source data tied to each visitor, no matter how many sessions or page views they log.
For example, imagine someone clicks on a LinkedIn ad, browses your site, leaves, and returns days later by typing your URL directly. With persistent attribution, Madlitics tracks the original source - LinkedIn - not "Direct", when they eventually submit a form. This approach avoids the misattribution common with last-click models.
By maintaining a complete record from first interaction to final conversion, Madlitics ensures the hidden fields in your forms always reflect the original channel, campaign, and creative details.
After setting up persistent tracking, keeping your data consistent is crucial. Marketing data can often be messy - campaign names might vary ("Spring_Sale" vs. "spring-sale"), UTM parameters might have typos, and naming conventions can differ across teams. Madlitics automatically organizes and standardizes this data into a clean taxonomy - Platform > Campaign > Creative - so you don’t have to reconcile it manually.
The platform also categorizes traffic sources, even when UTM parameters are missing. Organic search, social media referrals, and direct visits are automatically classified, giving you a complete view of how visitors find your site.
In addition, Madlitics provides insights into landing page performance. The lp and lpg fields reveal which landing pages drive conversions from specific channels. For instance, you might learn that your pricing page converts LinkedIn traffic better than your homepage or that certain blog topics generate higher-quality leads. These insights help you refine both your channel strategy and content promotion efforts.
"Smarter marketing starts here... Madlitics shows you what's actually driving leads, revenue, and growth." – Madlitics
With attribution data automatically feeding into your CRM, every lead comes with the marketing context you need to measure campaign ROI and pinpoint which strategies are driving real results.
After setting up tracking and attribution, the next step is turning your data into meaningful insights that can improve your campaigns. With the right tools, you can identify where customers drop off using funnel analysis, understand long-term customer value versus quick churn with cohort analysis, and compare performance across channels, devices, audience demographics, and content types. These methods help highlight which segments are thriving and which need attention, laying the foundation for informed campaign adjustments.
To get a clear picture of campaign performance, compare time periods with similar conditions - like Q4 2025 vs. Q4 2024 - to account for seasonality. Automated alerts can be a lifesaver, notifying you when metrics like cost per acquisition exceed targets or when conversion rates fall below expectations. This way, you can tackle problems as they arise instead of waiting for the next monthly report.
Incrementality testing is another powerful tool. It helps separate conversions that your marketing directly influenced from those that would have happened anyway. Research shows that only 35–40% of attributed conversions are truly incremental. You can measure this through geo-based tests, dividing markets into treatment and control groups, or by reserving 10–20% of your budget for control segments to gauge the actual impact of your campaigns.
These techniques provide the insights needed to reallocate budgets, refine strategies, and test new approaches effectively.
Once you’ve identified patterns in your campaign performance, use that knowledge to adjust your budget. Shift funds from struggling segments to those delivering better results. For example, run a two-week test with 50% of your budget. If one variant delivers a 20% higher ROAS, reallocate the rest of the budget to that option. Keep an eye on your LTV:CAC ratio, aiming for at least a 3:1 ratio to ensure sustainable growth.
Predictive analytics can also help you stay ahead. By forecasting which audiences are likely to convert or churn, you can make proactive decisions. Machine learning tools can flag anomalies, allowing you to redirect budgets from underperforming channels to those showing potential. Businesses that adopt advanced attribution models, like multi-touch or data-driven approaches, often see a 15–25% boost in marketing ROI compared to relying on last-click models.
The real goal is to move from reactive reporting to real-time optimization. By catching problems early and seizing opportunities as they emerge, you can keep your campaigns on track and maximize their impact.

https://yoursite.com/?utm_source=linkedin&utm_medium=paidsocial&utm_campaign=q1_promo

Tracking campaign performance is no longer optional - 89% of marketers now face mounting pressure to prove their impact clearly. With the decline of third-party cookies and stricter privacy regulations, sticking to outdated tracking methods means grappling with incomplete data and unreliable insights.
This guide has outlined the key steps to navigating these challenges: setting meaningful KPIs, adopting attribution to map the entire customer journey, and leveraging real-time data to fine-tune your campaigns before they drain your budget. Advanced attribution models have shown to boost marketing ROI by 15-25% and improve campaign ROI by 3-5x compared to manual reporting methods.
Tools like Madlitics simplify this process by capturing attribution data at the point of lead submission and enriching it with detailed marketing context. Features like persistent attribution, automated data cleaning, and landing page insights provide a seamless way to track and analyze conversions. By integrating these tools, you gain a clear, actionable view of what's driving your growth, without the frustration of piecing together data from multiple platforms.
The shift from reactive reporting to proactive optimization is where the real value lies. When you can pinpoint which channels are driving revenue, identify underperforming campaigns, and reallocate your budget in real time, you stop wasting resources and start scaling what works. With 73% of marketers identifying analytics as critical to their success, the difference between guessing and knowing comes down to having the right tracking infrastructure.
To get started, focus on building a clear UTM naming convention, implement server-side tracking to recover lost conversion data, and test incrementality on a quarterly basis to refine your attribution models. By following these precise strategies, you'll see measurable improvements in your campaign ROI and gain the insights needed to refine every aspect of your marketing efforts.