Analytics
Madlitics + Google Data Studio
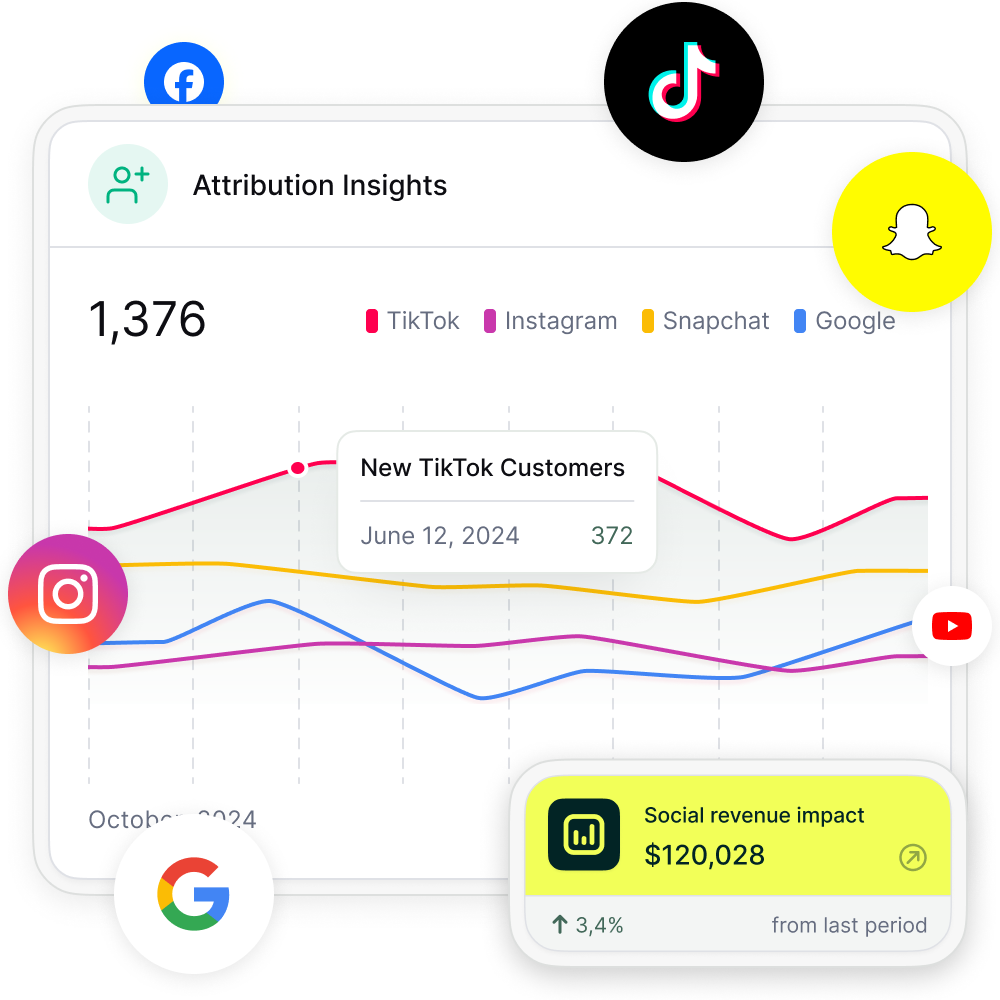
Visualize marketing attribution in Google Data Studio — Madlitics captures UTM parameters, first-touch sources, and campaign data, enabling you to build reports that connect marketing efforts to revenue.

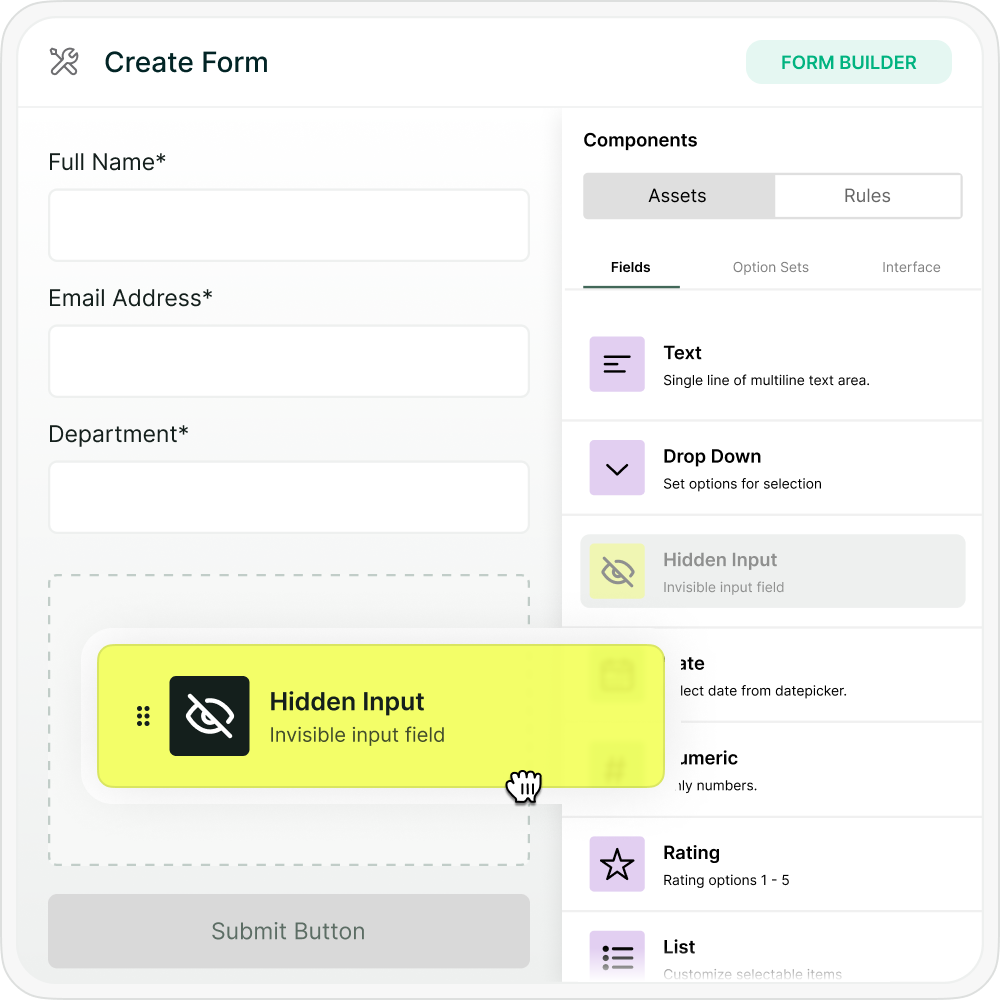
Add Madlitics to your site, update your existing forms with a few hidden fields, and let attribution data flow seamlessly.

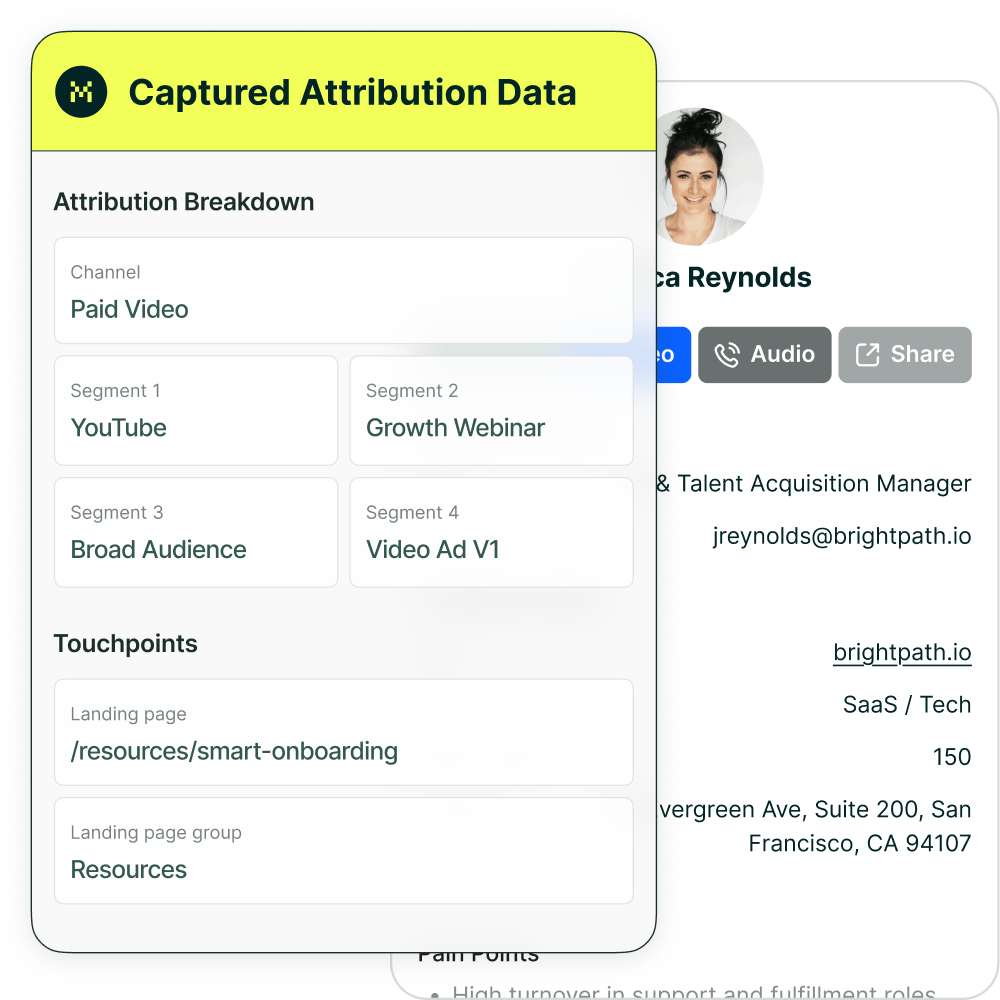
Madlitics determines where a visitor came from, whether it’s Paid Search, Organic Social, Referral, Email Marketing, and more. It records key attribution details, such as campaign name, landing page URL, and ad details, ensuring you always have a complete picture of the customer journey.